Expense Tracker in Flutter
Dart’s int becomes a JavaScript number on the web — the app tells you which one it is running on.
- Flutter
- Dart
- CustomPainter
About this project
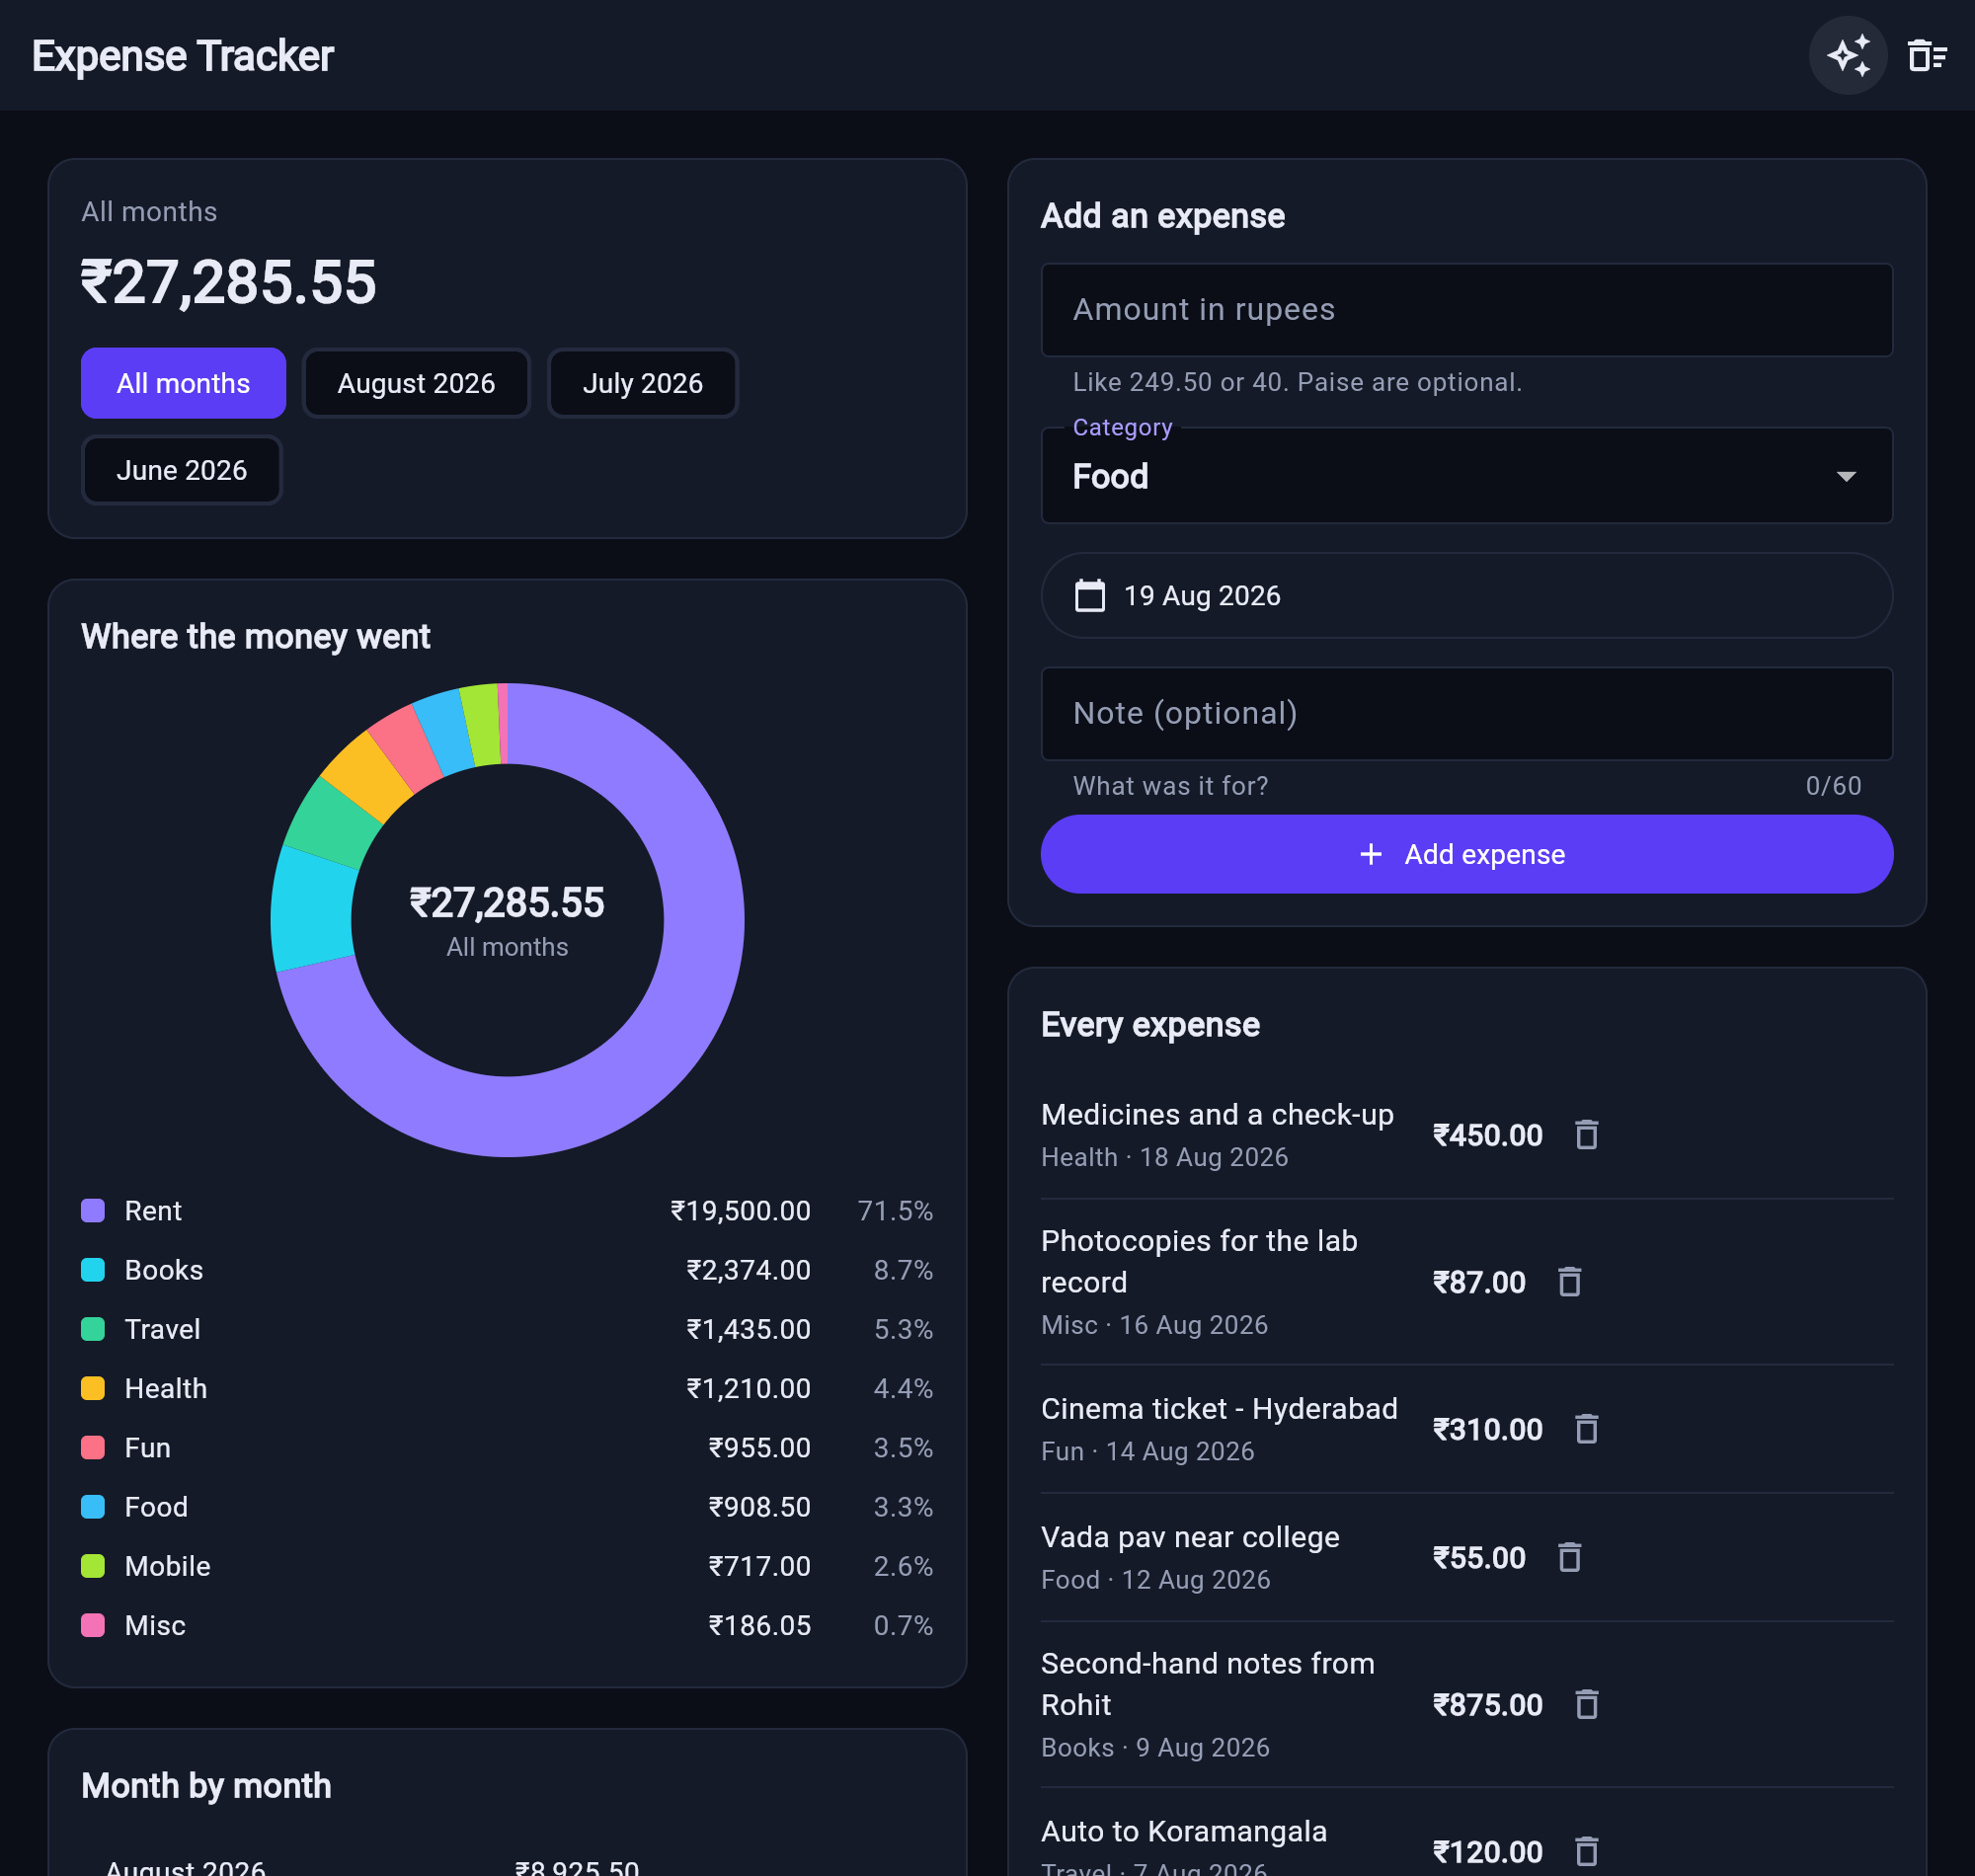
Record expenses in rupees with a category and a date, see totals per category and per month, and a donut chart drawn by hand rather than by a charting package. Saved to disk, and it runs on Android, Windows and the web from one source.
The idea it is built around is money in a framework that compiles to two different number systems. Amounts are whole paise in an int, never a double — but Dart’s int is a true 64-bit integer on a phone and becomes a JavaScript number once compiled for the web, where integers stop being exact above 2^53. The app detects which one it is running on and shows you: on the web it prints int.parse("9007199254740993") coming back as 9007199254740992, rounded down by one. It also says plainly why this does not matter for an expense tracker — a crore of rupees is 10^9 paise, far inside the safe range — and where it would begin to matter.
The second theme is that a chart is arithmetic and a canvas, not a library. The donut is drawn with CustomPainter, so the angles are yours, and the empty case says there is nothing to show rather than drawing an empty ring.
What you will learn
- Store money as whole paise in an int, and know exactly where that stops being exact
- Understand that Dart’s int is 64-bit natively and a double once compiled to JavaScript
- Format for an Indian audience with lakh grouping rather than thousands
- Draw a chart yourself with CustomPainter, and handle the empty case honestly
- Group and total records by category and by month without a database
Before you start
- Some Flutter — widgets, state and a list view
- Flutter 3.19 or newer, and any one target including just Chrome
Academic integrity notice
These projects are provided for learning, experimentation and reference. Understand the code, modify it for your own requirements, and acknowledge external work according to your institution’s academic policies. Priodemy does not supply work to be submitted as your own.
Features
- Expenses with category, date and note, totalled by category and by month
- A donut chart drawn with CustomPainter — no charting package
- Rupee formatting with lakh grouping, not thousands
- An Under the hood panel that detects the platform and shows the real 2^53 boundary
- Sample data loadable in one tap, so the app is never just an empty screen
- Real tests covering the store, the formatting and the layout; zero analyzer warnings
Technology stack
Track: Mobile · Level: Mini project
What is included
- A complete Flutter project — models, store, painter, widgets and tests, commented throughout
- A README on integer money, the web number boundary and CustomPainter
- Suggested extensions, including budgets and a CSV export
Delivered as a 70 KB ZIP. SHA-256 published under Changelog so you can verify it.
System requirements
- Operating system
- Windows, macOS or Linux
- Runtime
- Flutter 3.19 or newer. flutter pub get, then flutter run.
Licence
Learn from it, change it, and use it in your own coursework and personal projects. Do not resell it or pass it off as your own original work.
- Personal and educational use
- Modifying the code however you like
- Using it as the basis of your own coursework, with honest acknowledgement
- Putting your modified version in a portfolio or on your own GitHub
- Reselling or redistributing the project, modified or not
- Presenting it as your own original work
- Commercial deployment — see the Commercial licence
Support window: 6 months from download.
Frequently asked
Why store paise instead of rupees?
Because 249.50 in a double is not 249.50, and money that drifts is money you cannot reconcile. An int of 24950 paise cannot drift. Every amount in the app is whole paise, turned into rupees only at the moment it is displayed.
What is the Under the hood panel telling me?
Which number system this build is actually using. Dart’s int is a true 64-bit integer on Android and Windows, but on the web it compiles to a JavaScript number, which stops being exact past 2^53. The panel prints that boundary and demonstrates it, so you see the limit rather than read about it.
Why draw the chart by hand?
Because a donut chart is a few angles and a canvas, and doing it once removes the fear of drawing anything at all. It also means the project has no charting dependency to go stale.
Changelog
- First release
SHA-2563b6e305a4d1b13285c8afcd1c281138bfea2305c0998c6d70a1834de1621ef01
You might also like
 Free
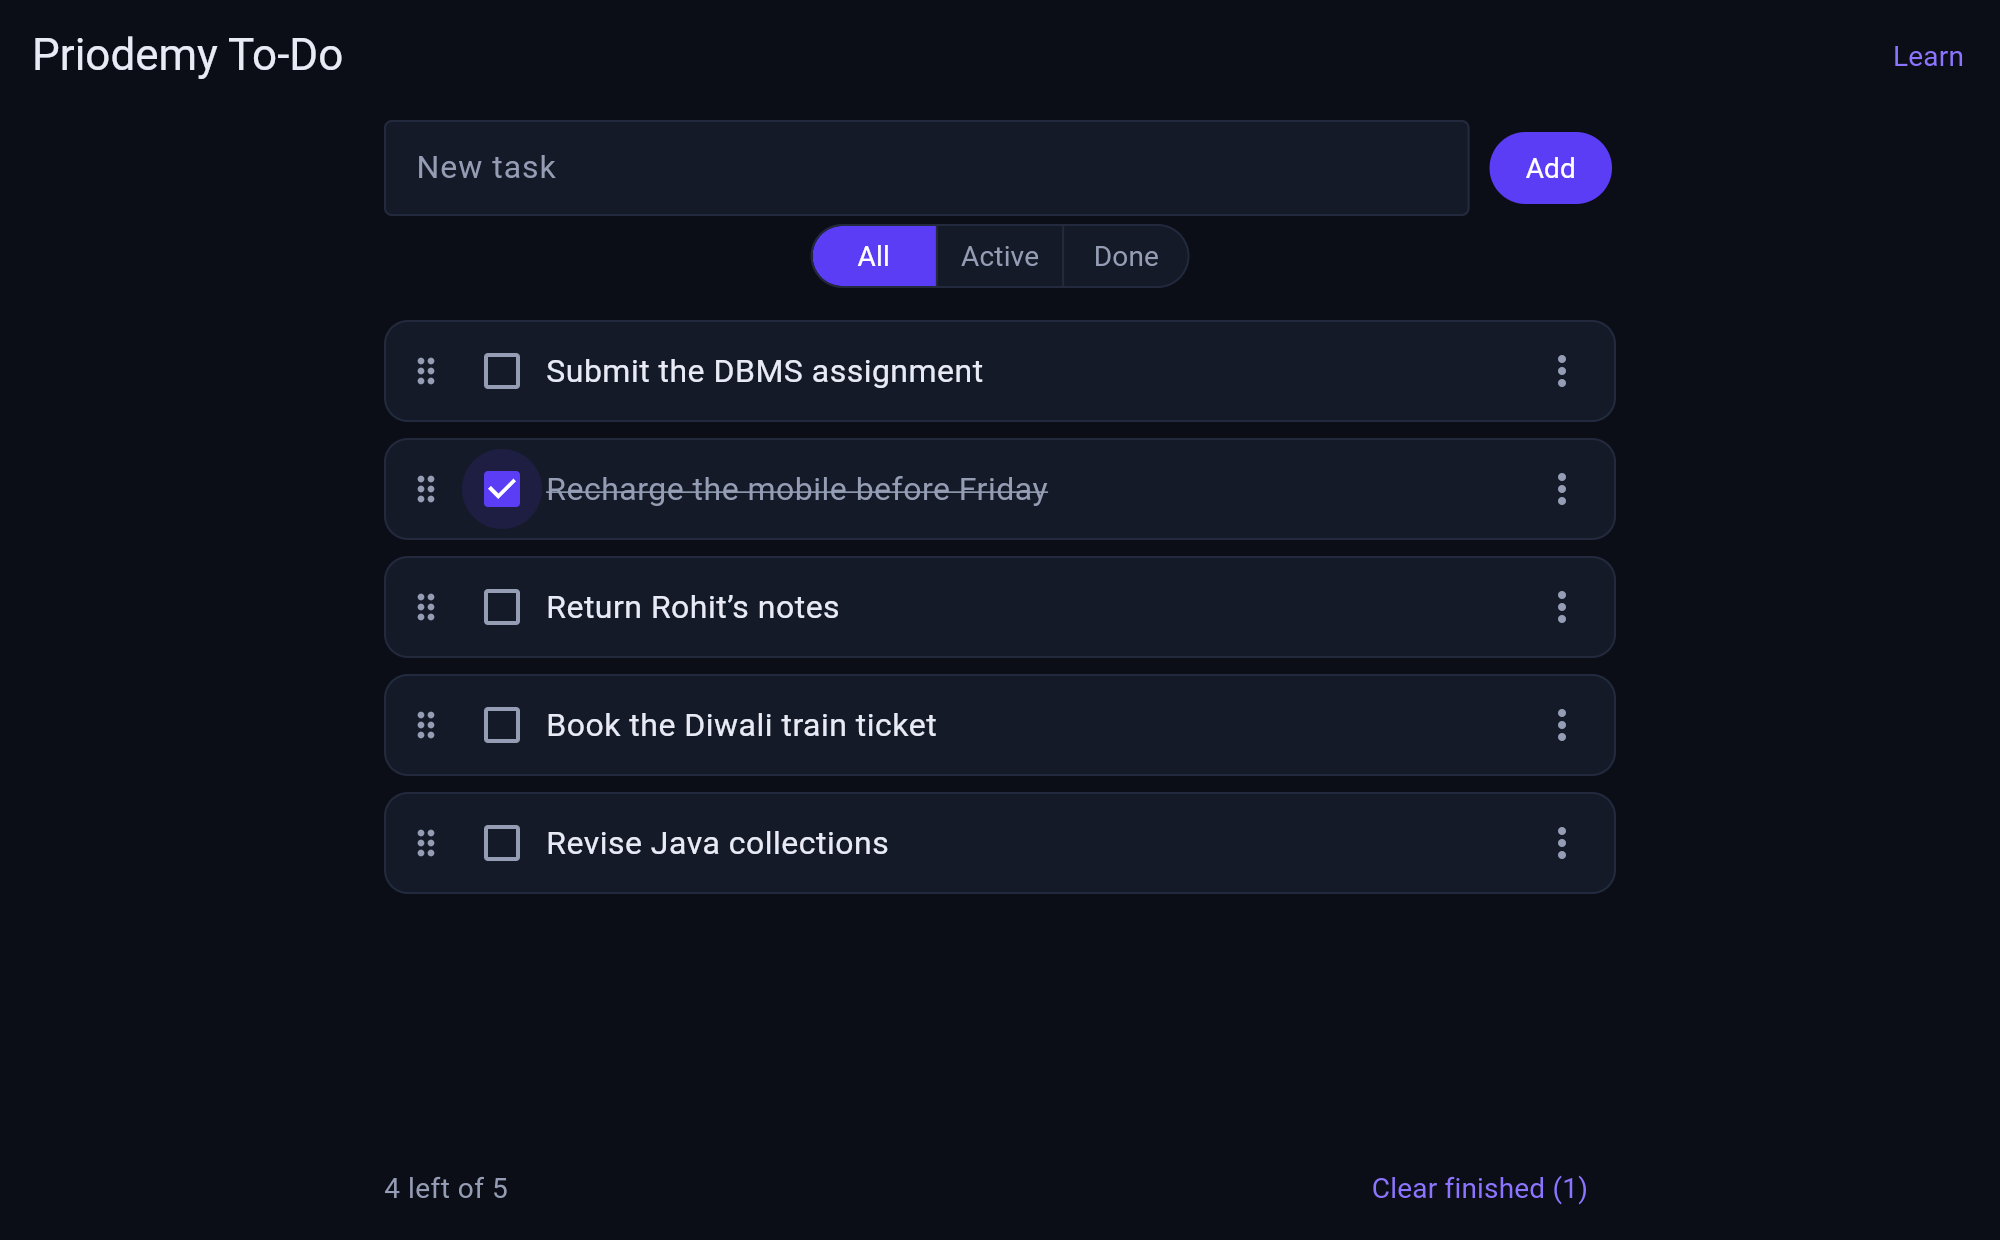
Free To-Do App in Flutter
setState does not update the screen — it marks a subtree dirty, and the difference is the whole model.
- Flutter
- Dart
 Premium
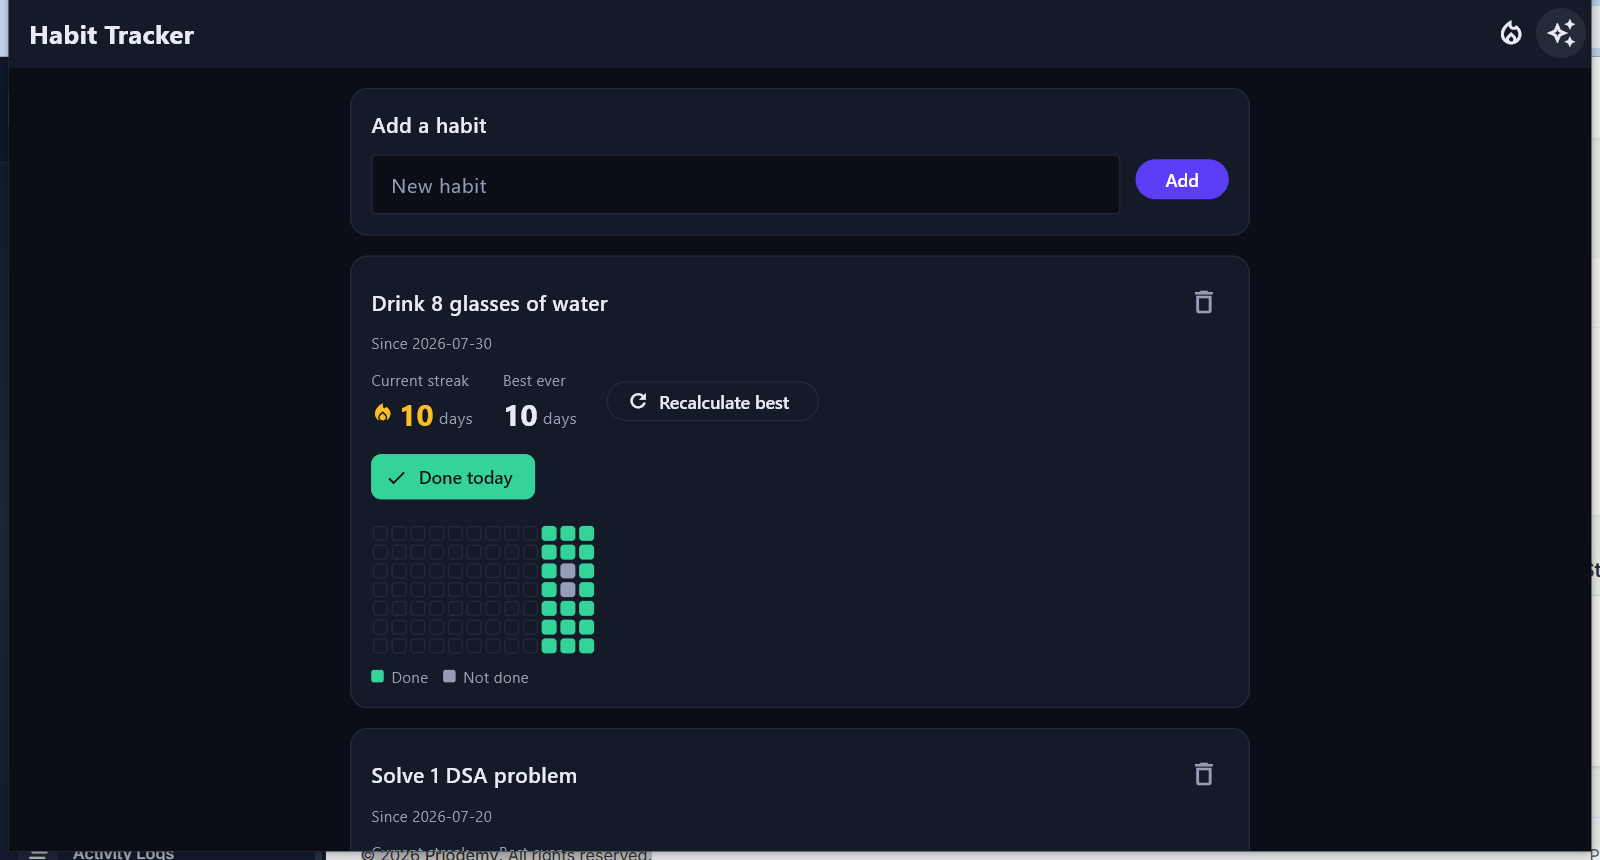
 Habit Tracker with SQLite
A streak is a claim about consecutive days, and the boundary cases are where every naive counter breaks.
- Flutter
- Dart
- SQLite
 Premium
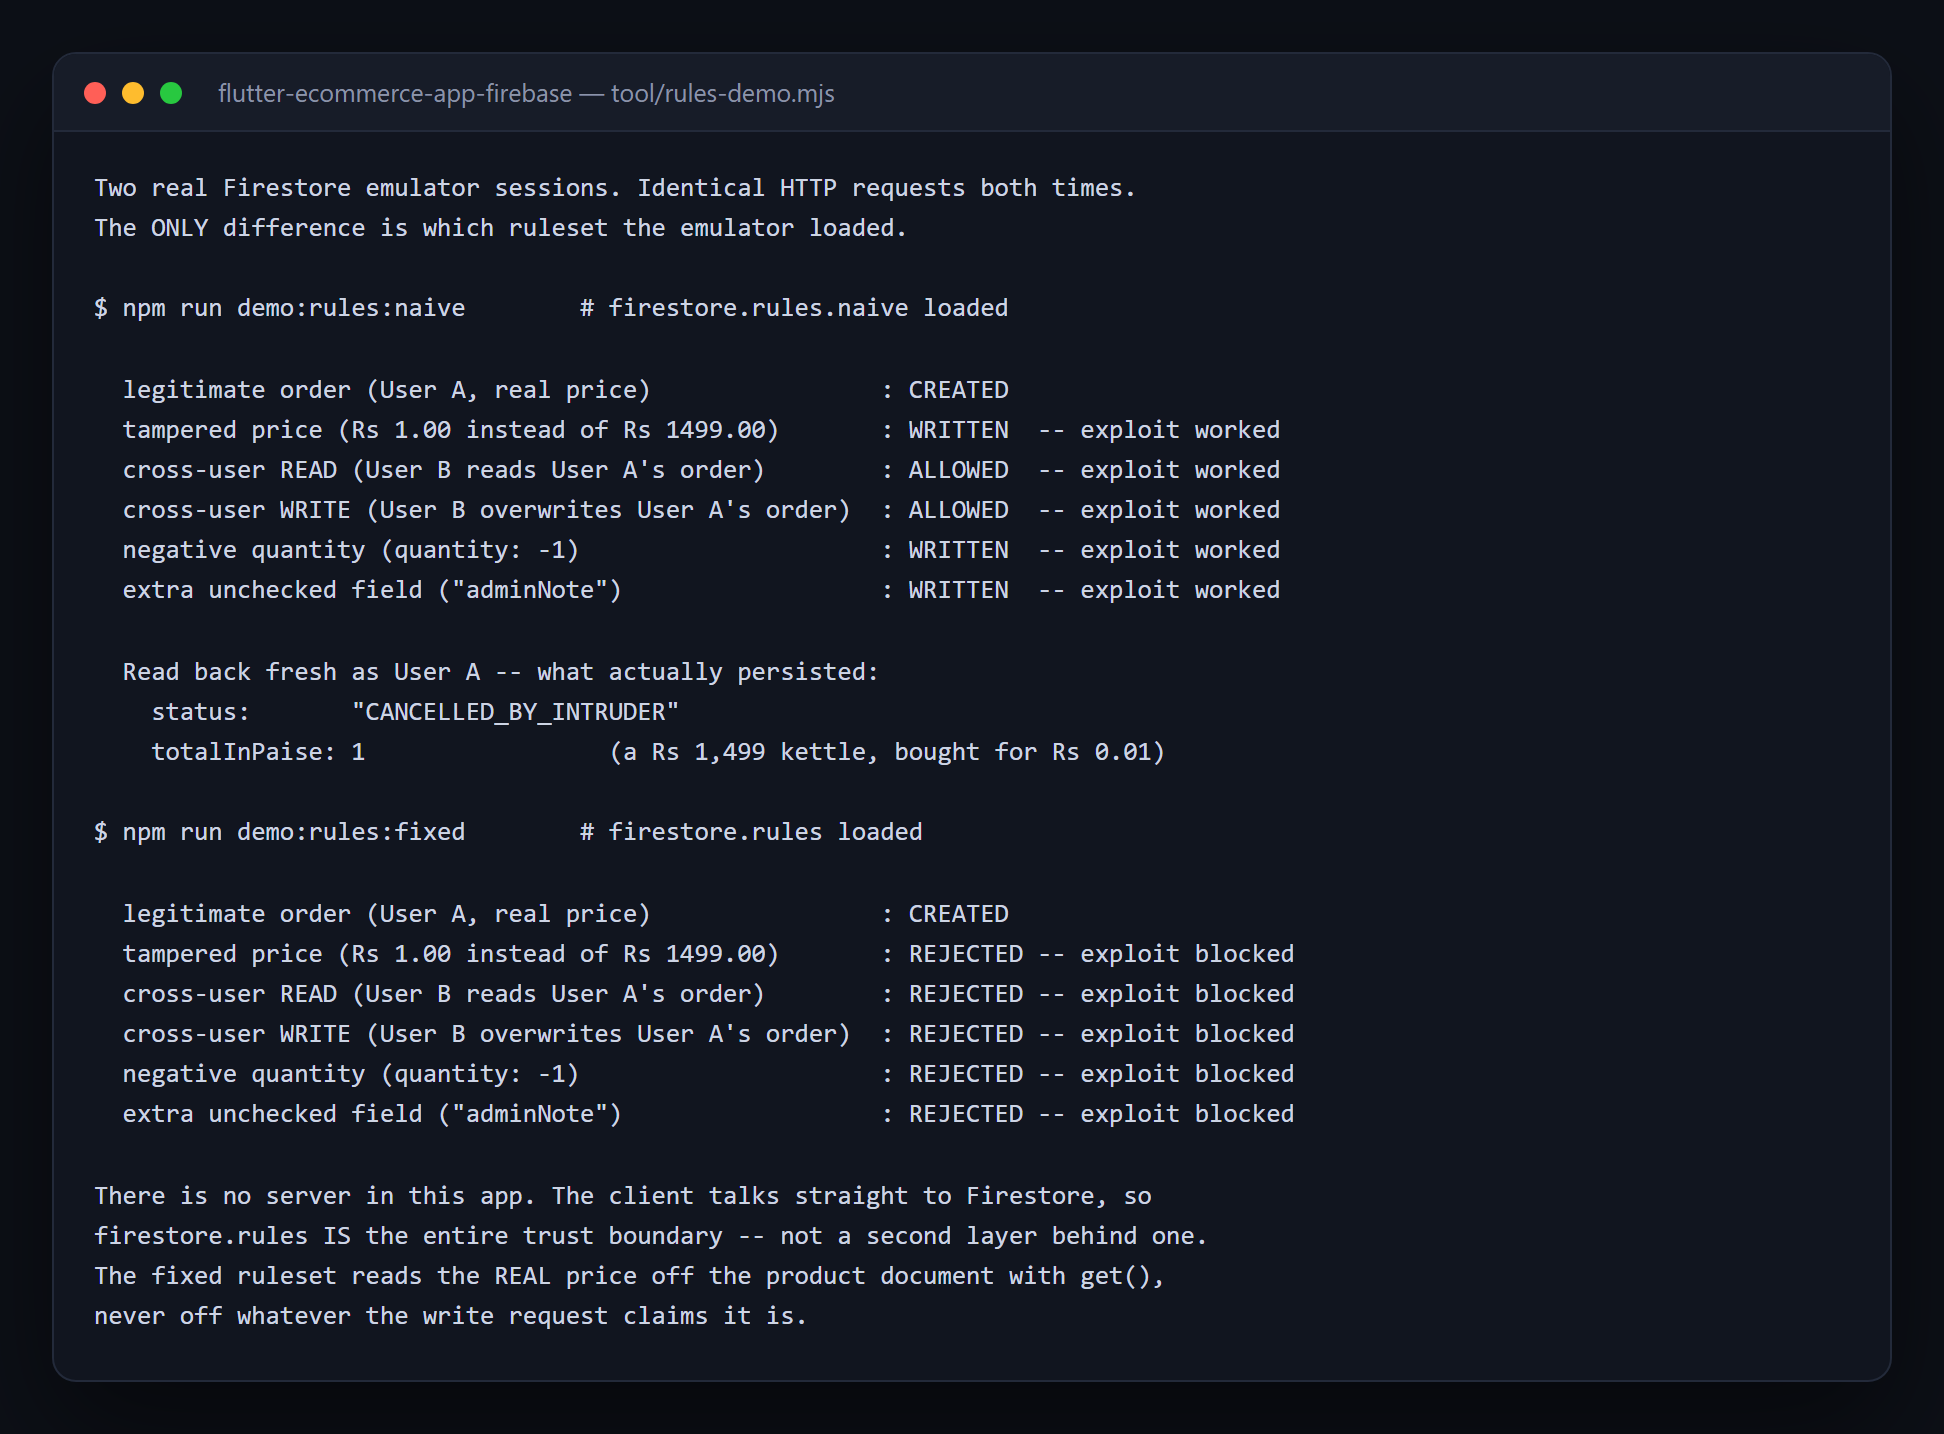
 E-Commerce App (Flutter)
There is no server to fall back on — when the client talks straight to Firestore, the rules file IS the entire trust boundary.
- Flutter
- Dart
- Firebase
 Premium
 Real-Time Chat App
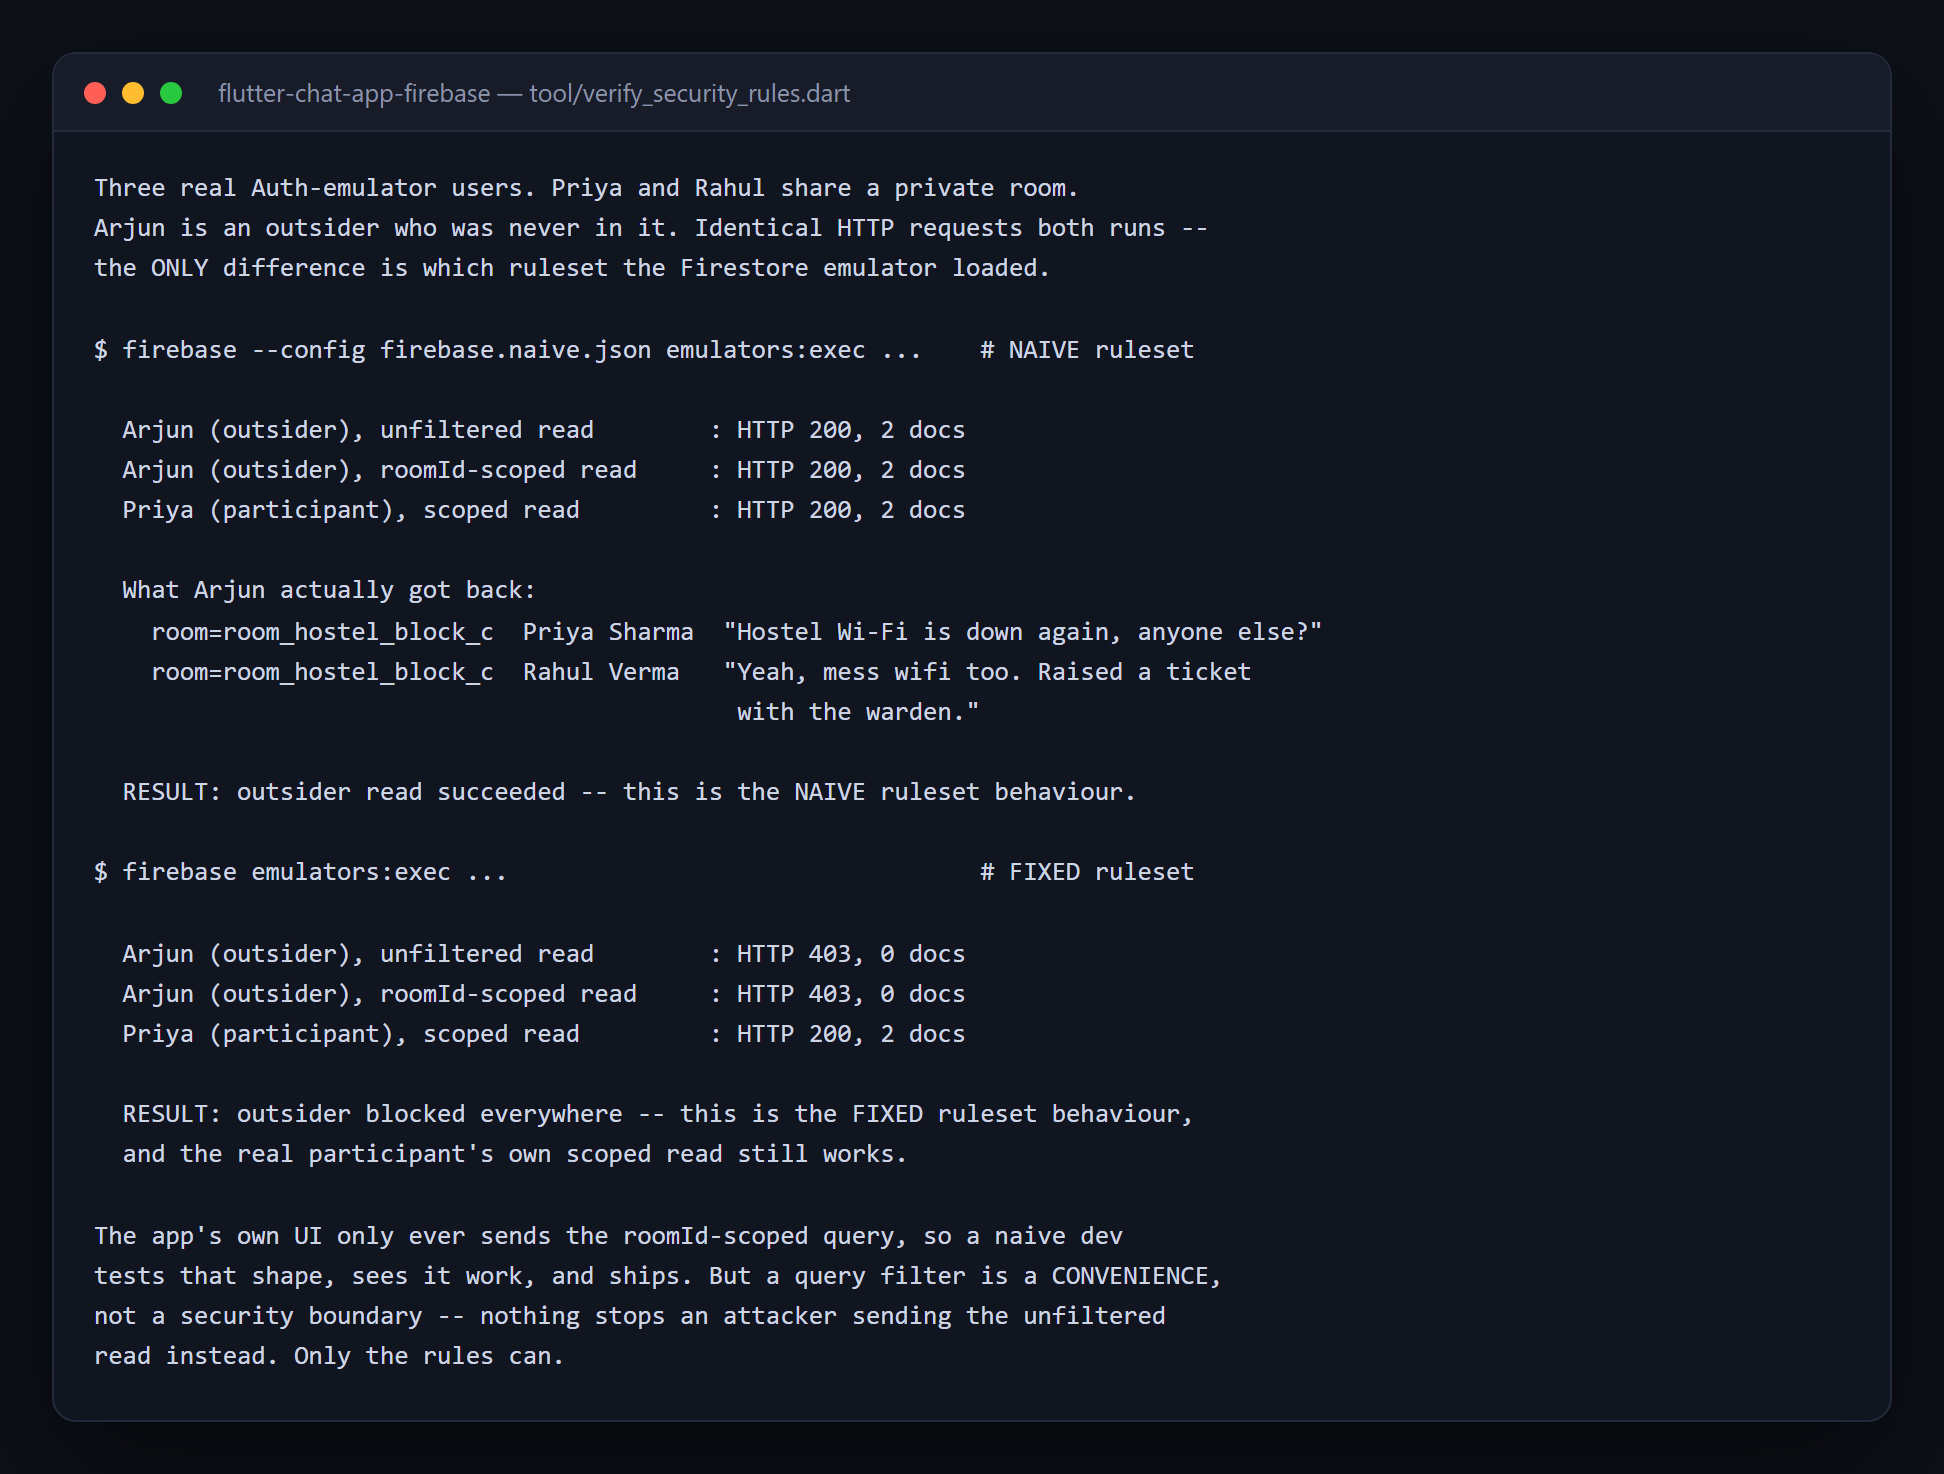
A query filter is a convenience, not a security boundary — nothing stops an attacker sending the unfiltered read instead.
- Flutter
- Dart
- Firebase