Report Automation
A report that silently trusts its input produces a polished, wrong number — and nobody double-checks a report that looks finished.
- Python
- openpyxl
- pandas
About this project
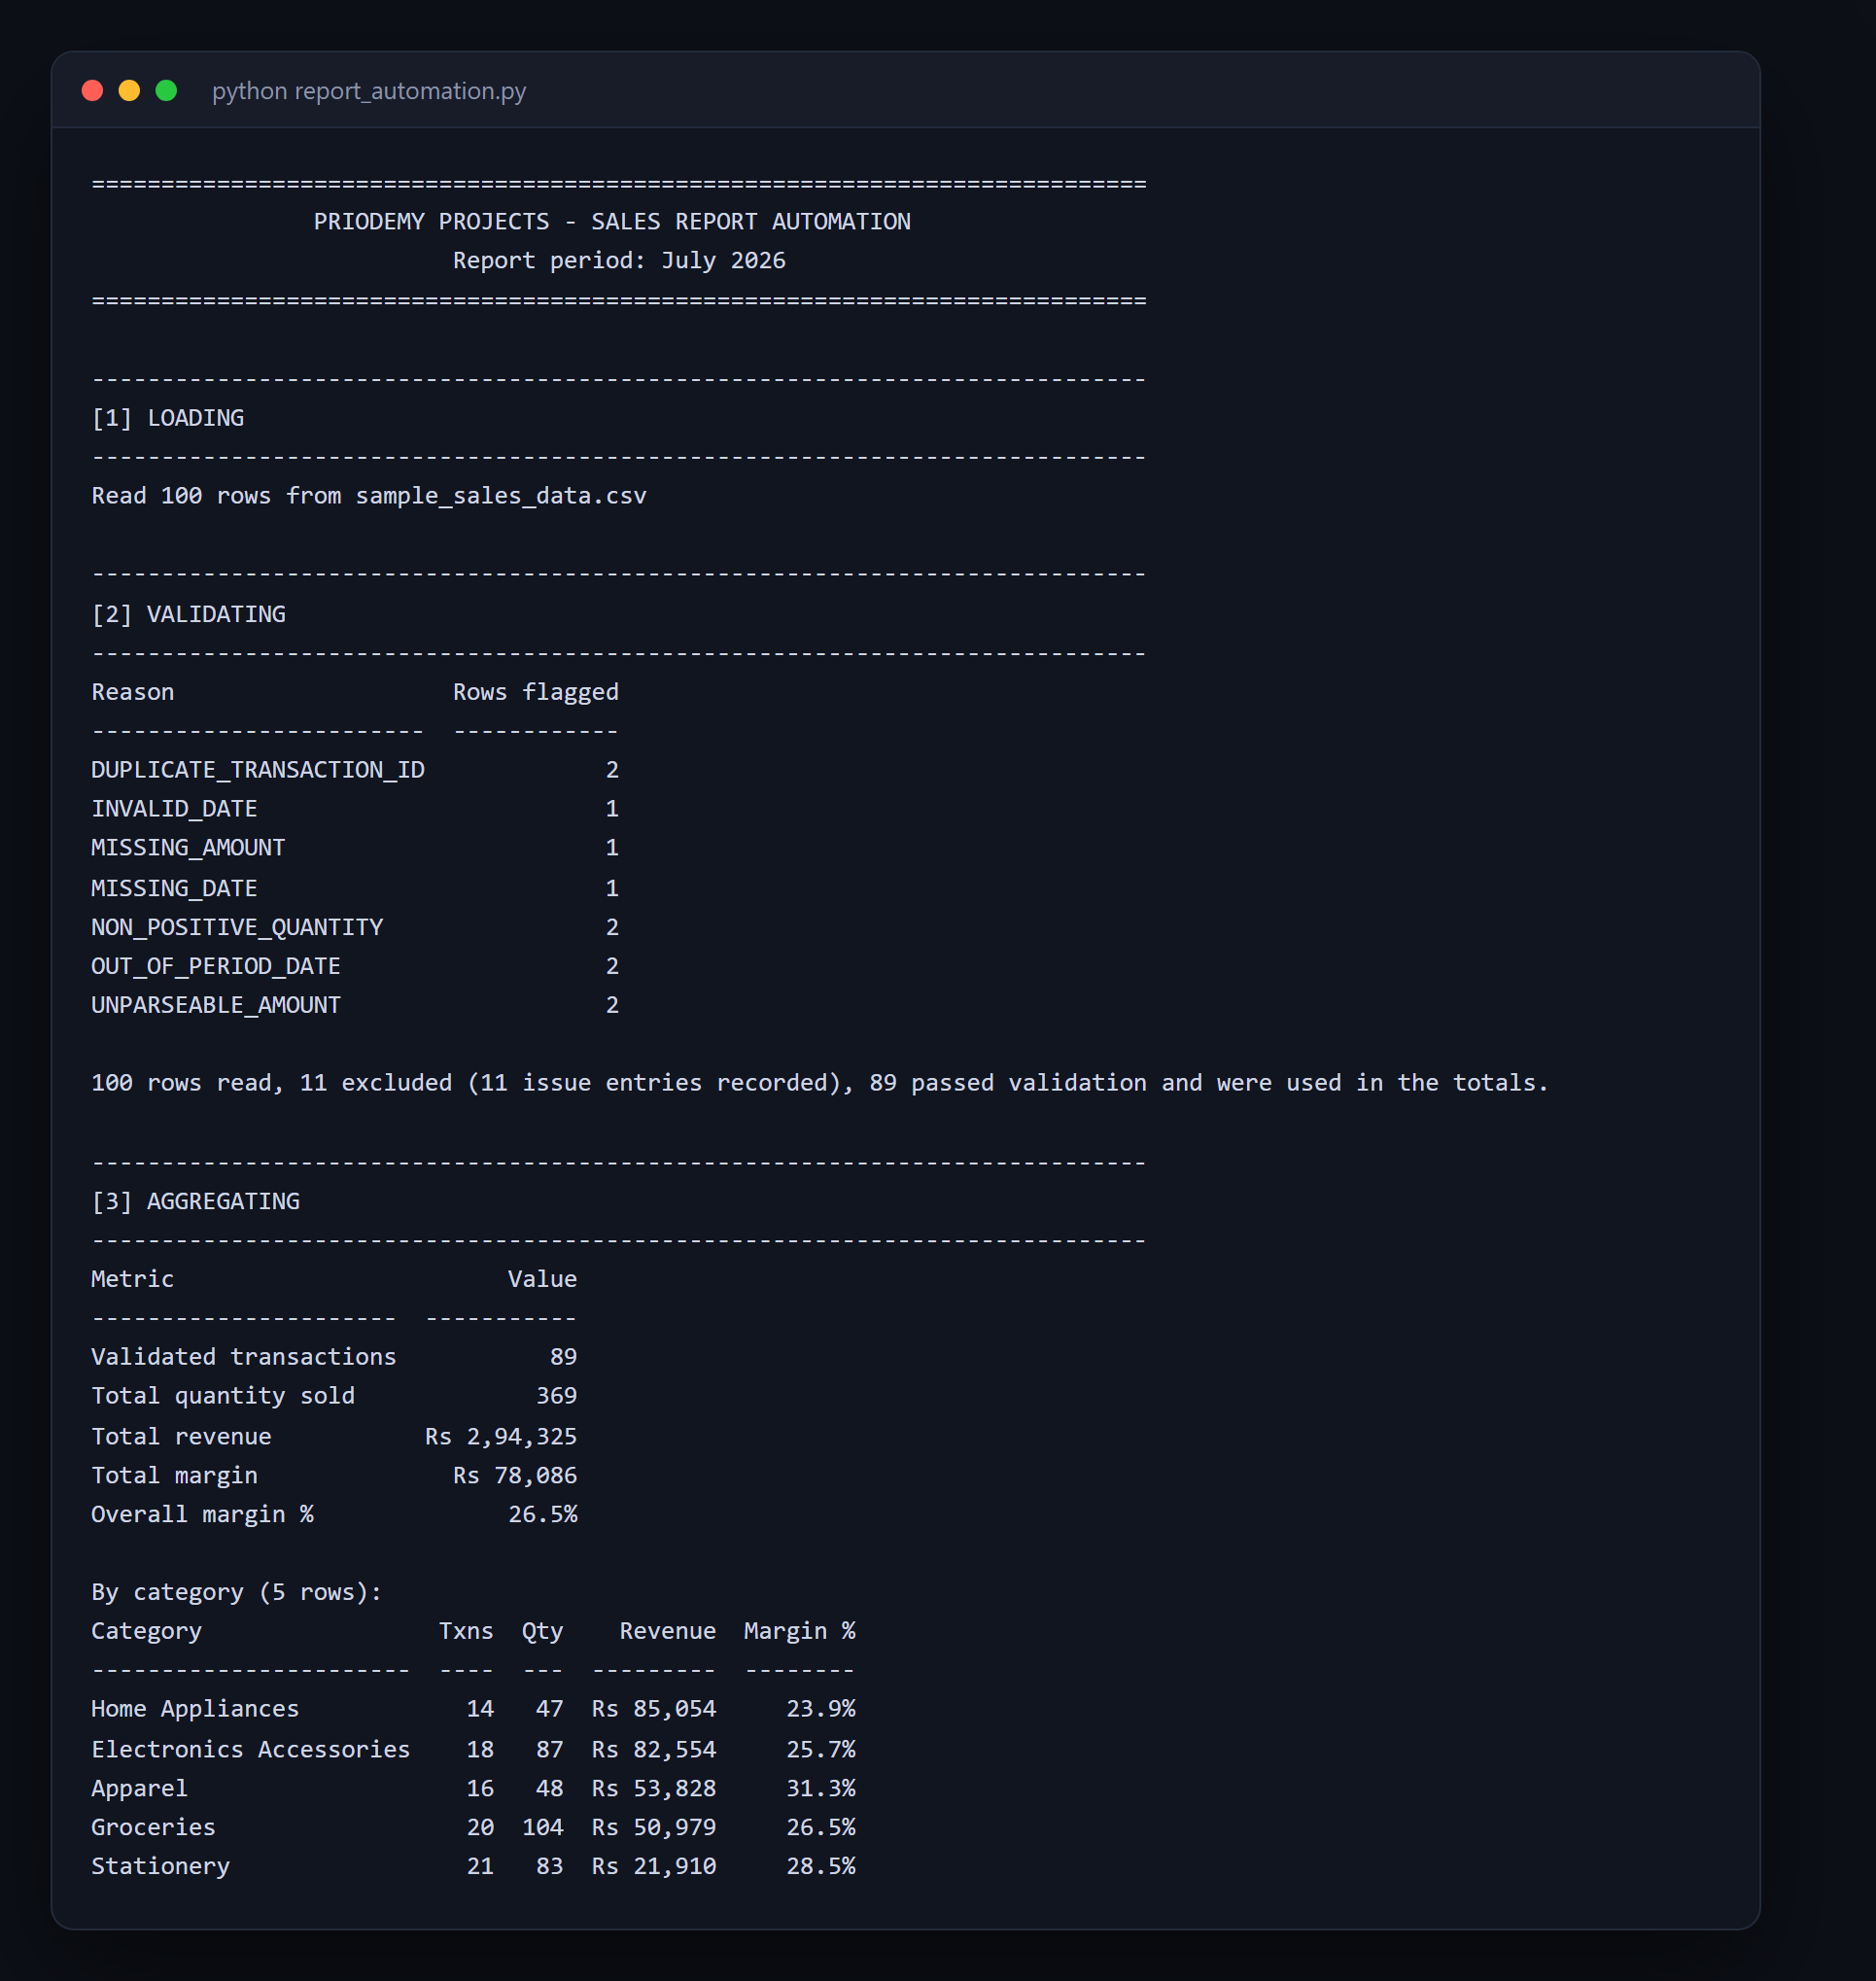
A pandas + openpyxl pipeline that turns a raw sales-transactions CSV into a formatted Excel workbook: headline totals, a category breakdown, a city breakdown, and — the part most CSV-to-Excel scripts skip — an explicit, row-by-row list of every transaction the report refused to trust, and exactly why.
The naive version of this script is two lines: read the CSV, sum a column. That runs, and it prints a number, and the number is wrong the moment the file contains any of the problems a real sales export accumulates within a month of someone editing it by hand — a duplicated transaction ID, a return recorded as a negative quantity, a blank or unparseable amount, a stray forward-dated row. None of those raise an exception, so nothing tells you the total is wrong, and a crash gets investigated while a polished-looking wrong number gets forwarded to a manager. This project's validation pass runs every row through seven named checks before anything is summed, excludes a failing row from every total, and writes it — in full, with the reason — to its own "Data Issues" sheet, so the report is auditable rather than just believed.
What you will learn
- Validate real-world messy input with named, specific checks instead of trusting it
- Never silently drop a bad row — record every exclusion with a reason, in an auditable place
- Write real openpyxl formatting: currency number formats, autofilter, frozen headers, conditional rules
- Reopen and read back the file you just wrote to confirm it, instead of trusting that saving didn't throw
- Repoint a report script at a different CSV schema by editing one dictionary, not rewriting the pipeline
Before you start
- Python basics — functions, dictionaries, and reading a CSV with pandas
- Python 3.10+, plus pandas and openpyxl — one pip command
New to Python? The free Python course covers everything this project assumes.
Academic integrity notice
These projects are provided for learning, experimentation and reference. Understand the code, modify it for your own requirements, and acknowledge external work according to your institution’s academic policies. Priodemy does not supply work to be submitted as your own.
Features
- Seven named validation checks — duplicate IDs, bad quantities, unparseable amounts, out-of-period or invalid dates
- Every excluded row is written to a "Data Issues" sheet with its reason, never silently dropped
- Real openpyxl styling: currency number formats, autofilter, frozen header row, styled headers
- A genuine conditional-formatting rule (not a fixed colour) flagging any sale below a margin threshold
- The workbook is reopened and read back after writing, with results printed, to confirm it is actually correct
- One dictionary at the top of the file remaps the whole pipeline onto a differently-named CSV schema
Technology stack
Track: Data & Analytics · Level: Mini project
What is included
- report_automation.py — the full pipeline, commented throughout
- sample_sales_data.csv — 100 realistic rows, 11 deliberately broken across every validation category
- A README on all seven checks, what triggers each one in the sample, and what deliberately does not
Delivered as a 20 KB ZIP. SHA-256 published under Changelog so you can verify it.
System requirements
- Operating system
- Any
- Runtime
- Python 3.10 or newer. pip install pandas openpyxl
Licence
Learn from it, change it, and use it in your own coursework and personal projects. Do not resell it or pass it off as your own original work.
- Personal and educational use
- Modifying the code however you like
- Using it as the basis of your own coursework, with honest acknowledgement
- Putting your modified version in a portfolio or on your own GitHub
- Reselling or redistributing the project, modified or not
- Presenting it as your own original work
- Commercial deployment — see the Commercial licence
Support window: 6 months from download.
Frequently asked
Will this work on my own CSV, not just the sample?
Point it at a similarly-shaped transactions file and edit SOURCE_COLUMNS at the top of report_automation.py to match your own column names — that is the only change needed for a same-shaped export. A file missing a column entirely (no unit cost, say) needs the margin calculation removed too; the README's "Things to try next" spells out exactly what to touch.
What happens to a row that fails validation — is it just deleted?
No. It is excluded from every total, but it is written in full — original row number, which check it failed, a human-readable reason, and every raw value — to a "Data Issues" sheet in the same workbook. The Report Summary sheet states the excluded count next to the totals it affects, so the caveat travels with the number instead of hiding in a log file.
Is the margin-threshold highlight a real Excel feature or just coloured cells?
A real openpyxl conditional-formatting rule attached to the column range, evaluated by Excel itself against whatever value ends up in each cell — not a colour painted once and frozen. Change MARGIN_THRESHOLD_PCT to your own margin floor and it keeps working.
Changelog
- First release
SHA-256459dfb9b1bd62036d3abd1622b9002f93d36e97029792aa23dd3a5f3d2c7ead9
You might also like
 Free
Free Data Analysis with pandas
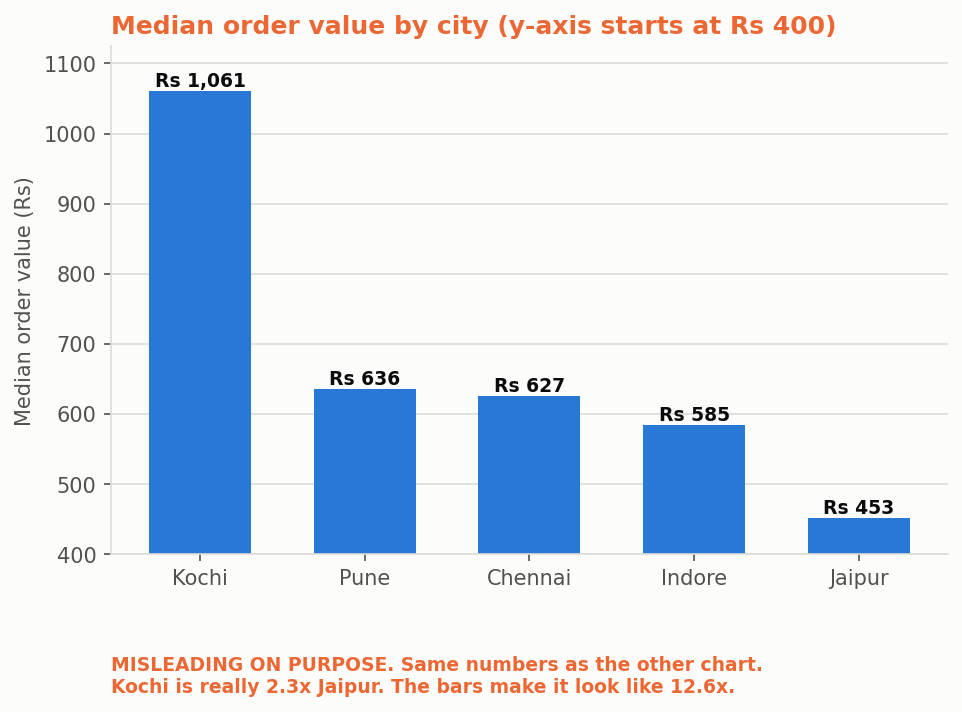
The summary statistic you choose is an argument, not a neutral fact.
- Python
- pandas
- Matplotlib
 Free
Free Retail Database Design (SQL)
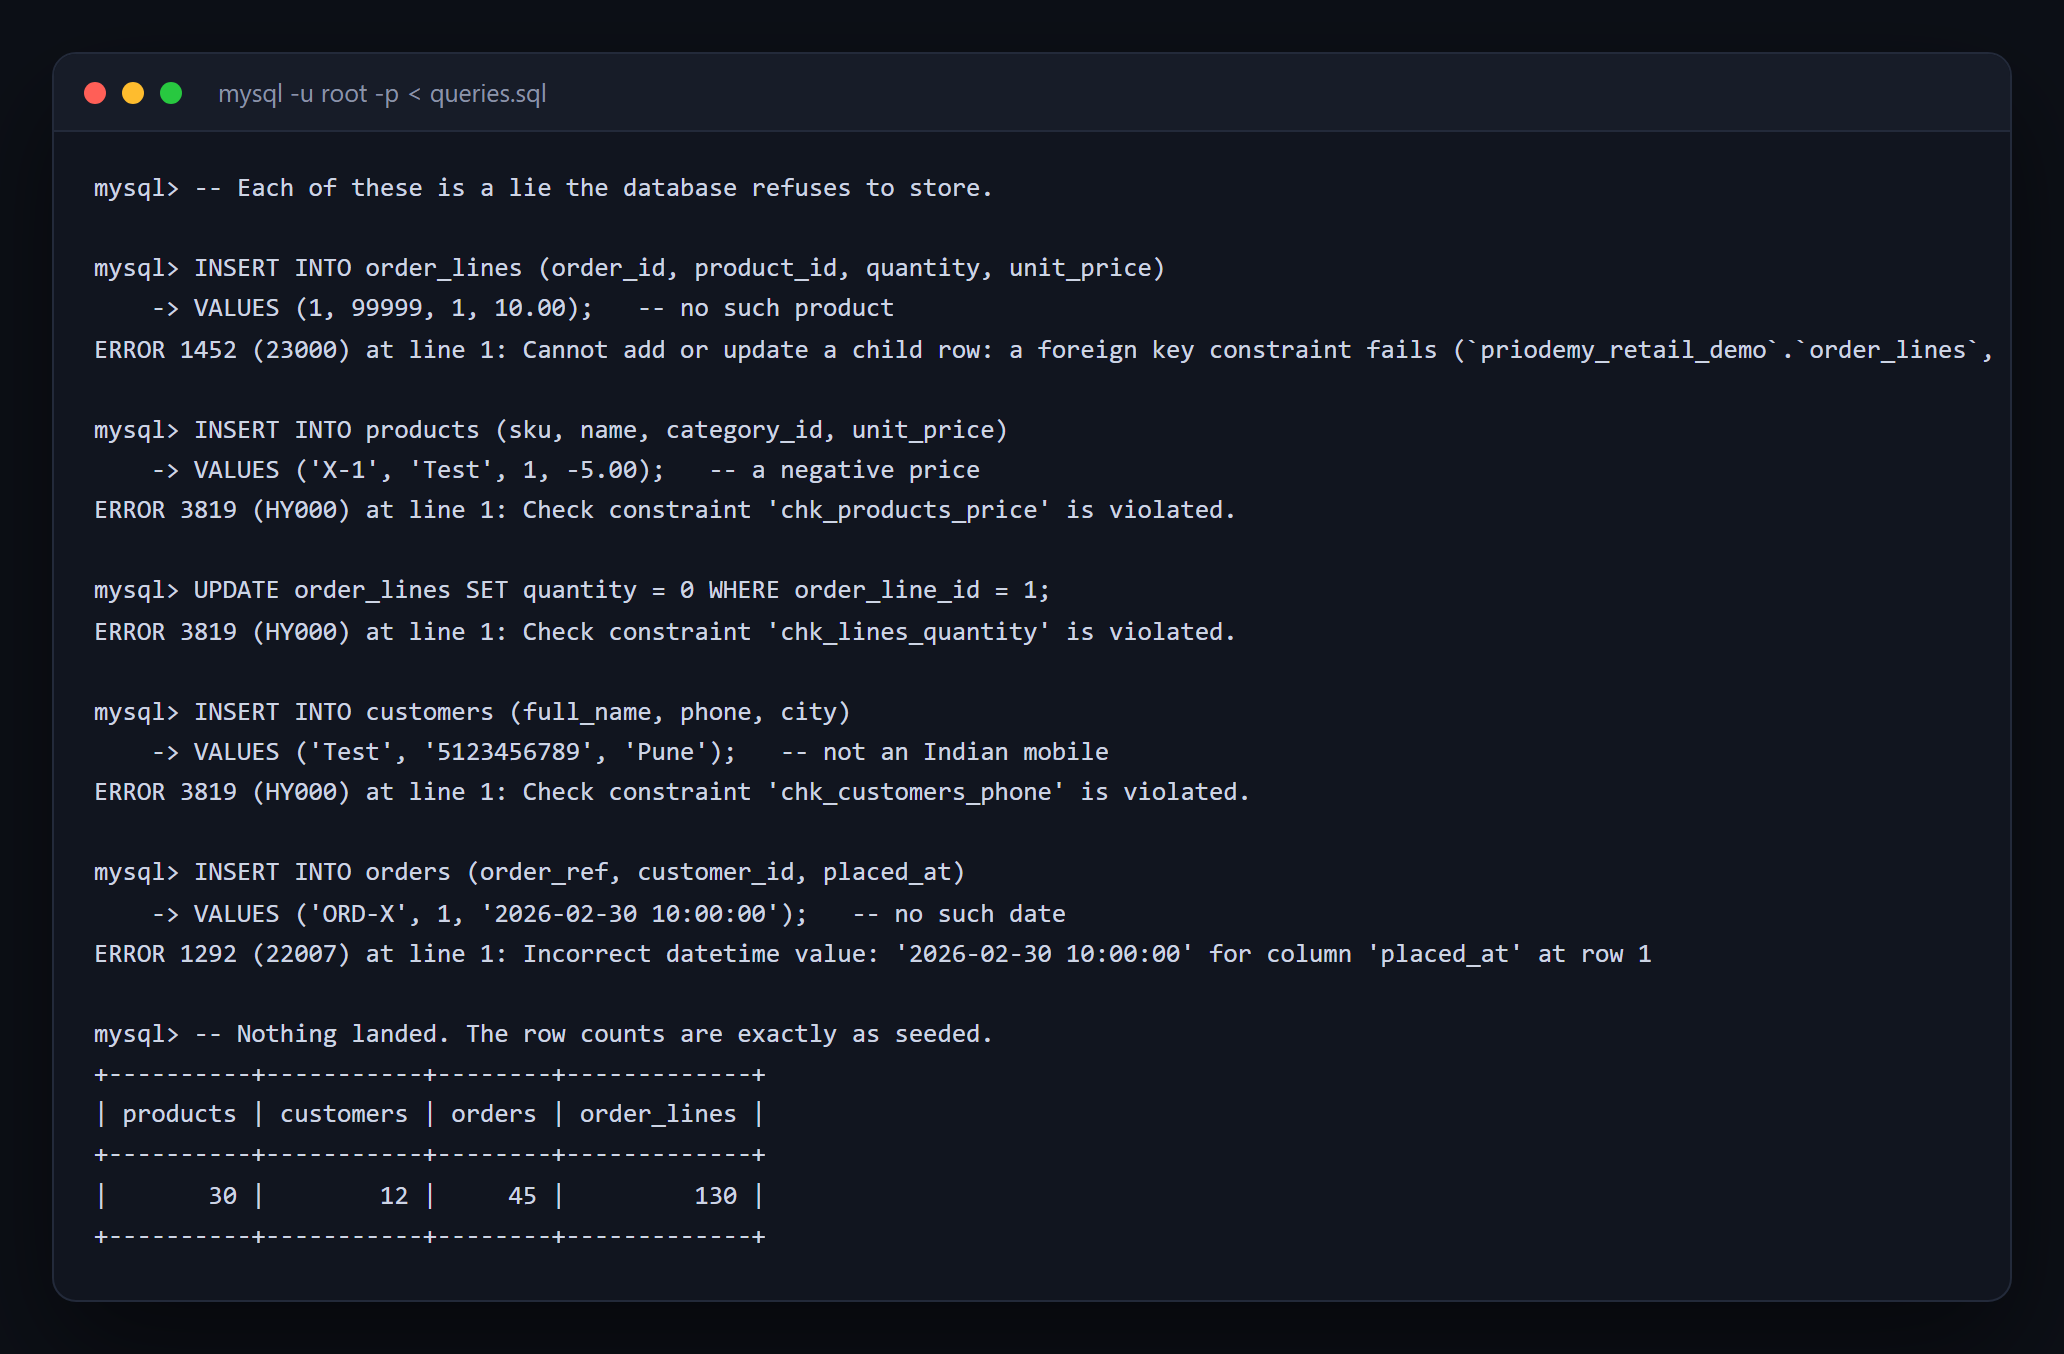
Normalisation is not bureaucracy — it is the prevention of lies, and the error message is the feature.
- SQL
- MySQL
 Pro
Pro Retail Sales Forecasting
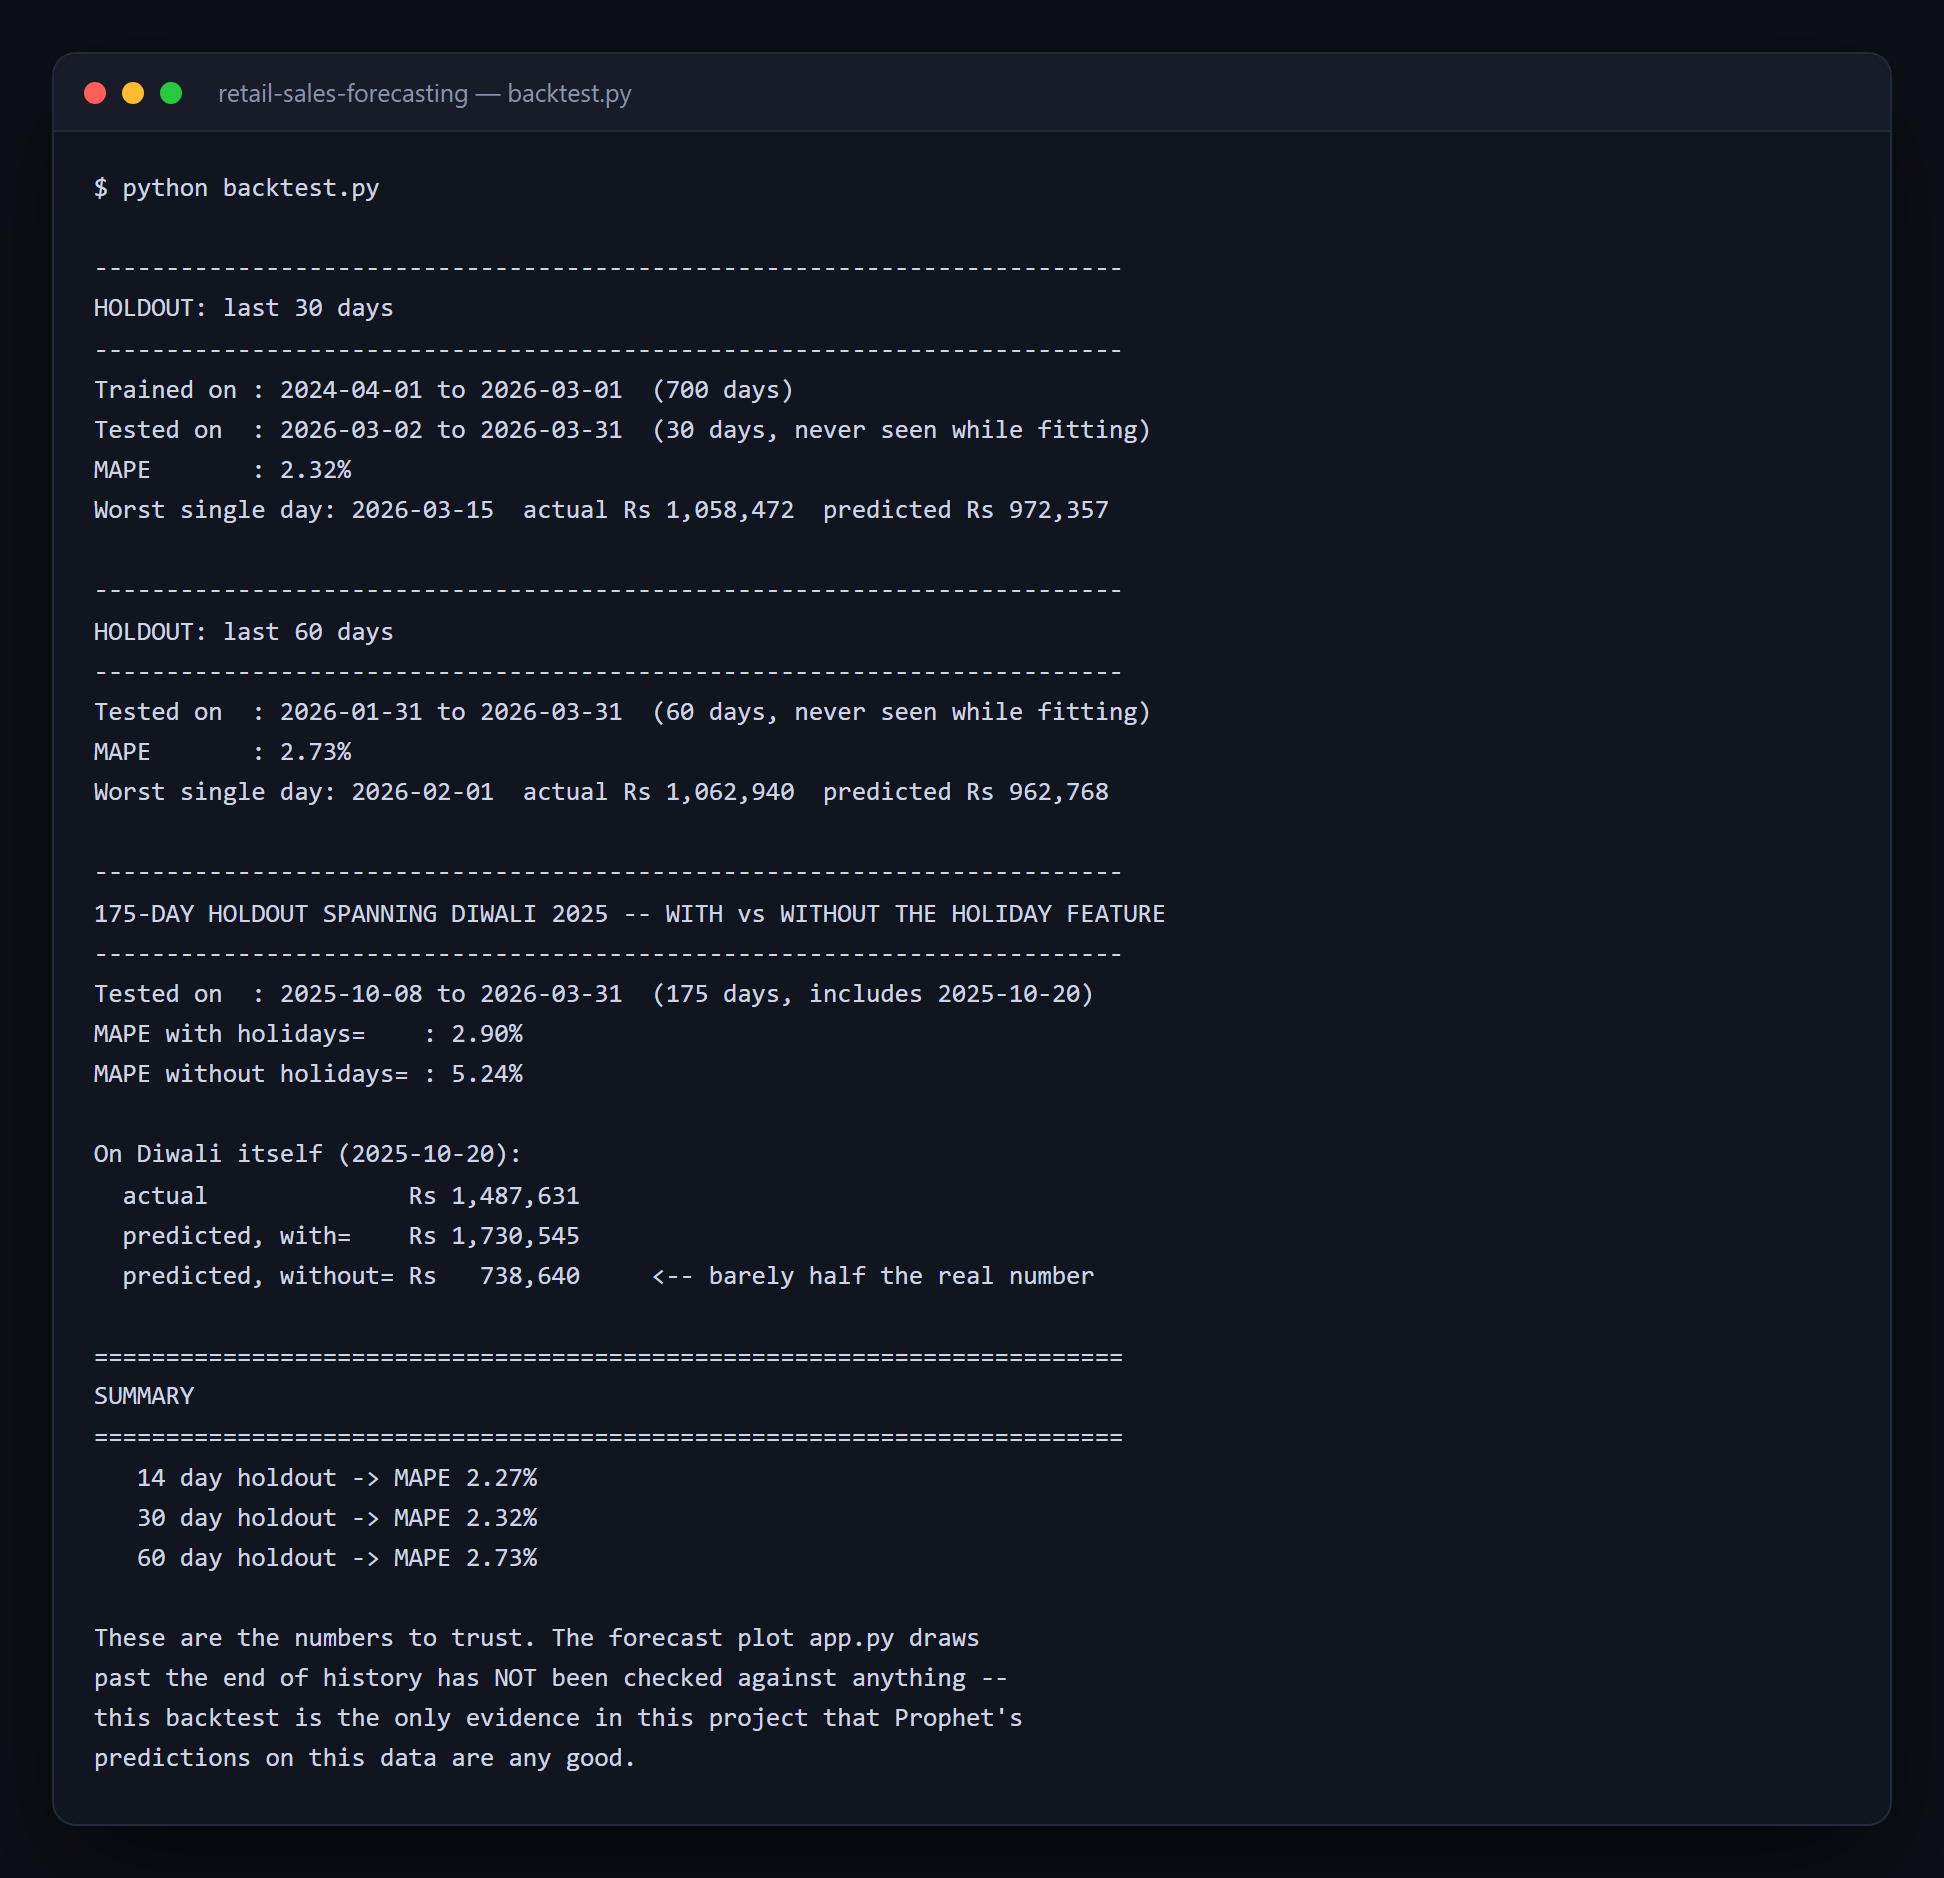
A forecast chart nobody backtested is a drawing — the only honest accuracy number comes from data the model never saw.
- Python
- Prophet
- Streamlit
 Free
Free ATM Simulation System
A working cash machine in Python and MySQL — balance, withdrawal, deposit and a transaction history.
- Python
- MySQL
- mysql-connector