Retail Sales Forecasting
A forecast chart nobody backtested is a drawing — the only honest accuracy number comes from data the model never saw.
- Python
- Prophet
- Streamlit
About this project
A daily retail sales forecaster over four Indian cities, built on Prophet, with a Streamlit dashboard. Almost every forecasting tutorial stops at a chart: fit a model on all the data, plot a line into the future, and call it a forecast. That chart has never been checked against anything — there is no way to know whether it is accurate to 2% or 40%.
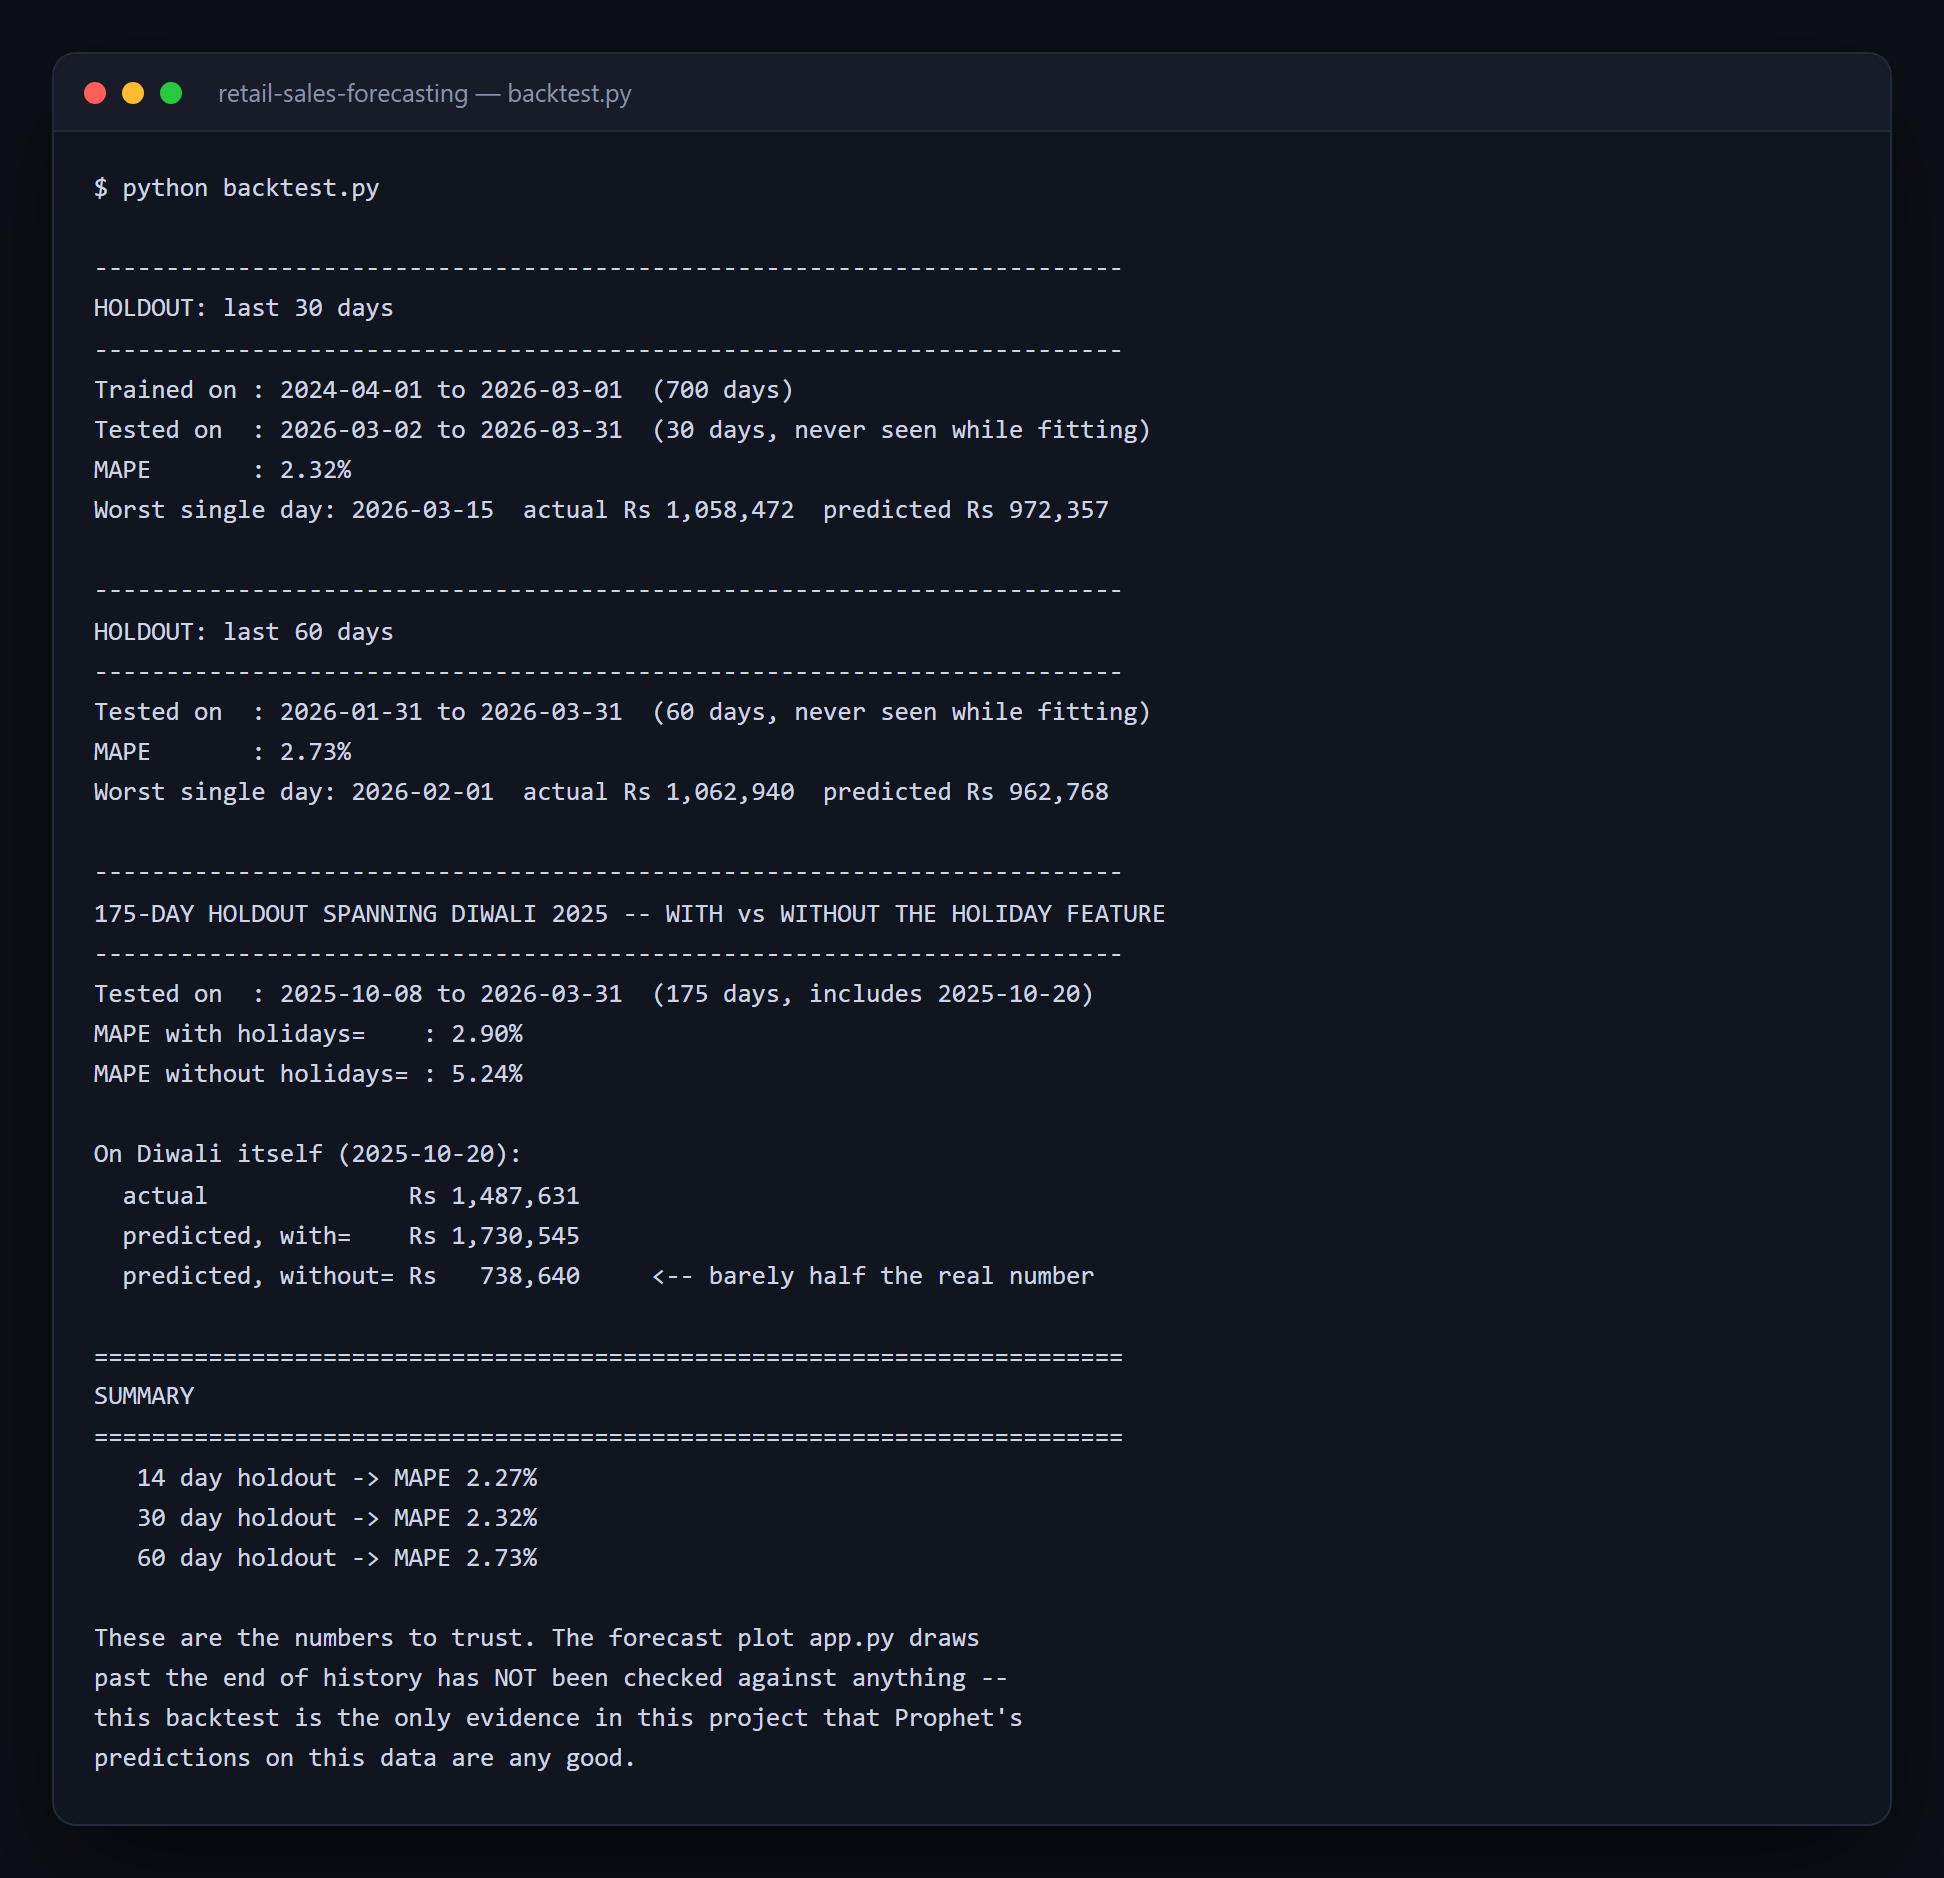
This project puts the measurement first. A walk-forward backtest fits only on data strictly before a holdout window, predicts that window, and compares against the real values the model never saw — producing a MAPE of 2.27% / 2.32% / 2.73% across 14, 30 and 60-day holdouts. The dashboard shows that backtested error above the forecast, not as a footnote under it. The same machinery then measures whether Prophet's holiday feature actually earns its place: on a 175-day window spanning Diwali 2025, MAPE is 2.90% with the holiday regressor and 5.24% without — and on Diwali itself, the model without it predicts barely half the real sales. That is a measured contribution, not an assumed one.
What you will learn
- Build a walk-forward backtest — fit only on data before the holdout, then score against withheld truth
- Compute and interpret MAPE, and know what a 2% vs a 5% figure actually means for a business
- Prove there is no data leakage between train and test rather than assuming it
- Measure a holiday regressor's real contribution instead of asserting that it helps
- Reuse the same backtest pattern for any time-series forecast — demand, enrolment, capacity
Before you start
- Python and pandas basics — DataFrames, dates, and filtering
- Python 3.10+ — Prophet and Streamlit install from PyPI, no GPU or API key needed
- Comfort with the idea of holding data back from a model to test it
New to Python? The free Python course covers everything this project assumes.
Academic integrity notice
These projects are provided for learning, experimentation and reference. Understand the code, modify it for your own requirements, and acknowledge external work according to your institution’s academic policies. Priodemy does not supply work to be submitted as your own.
Features
- A real walk-forward backtest — the only evidence in the project that any forecast is any good
- Real MAPE across 14/30/60-day holdouts, plus a 175-day window spanning a real Diwali
- A measured holiday-regressor comparison: 2.90% vs 5.24% MAPE, and the Diwali-day rupee figures behind it
- A Streamlit dashboard that puts backtested error above the forecast, not beneath it
- Reproducible synthetic data — a seeded generator whose CSV regenerates byte-for-byte identical
- Real Indian retail shape: weekly pattern, salary-day bump, and real Diwali dates for 2024 and 2025
Technology stack
Track: Data & Analytics · Level: Pro
What is included
- generate_data.py, forecasting.py, backtest.py and app.py — commented throughout
- retail_sales.csv — 2,920 rows of seeded, reproducible synthetic daily sales across four cities
- A README explaining backtesting, MAPE, and exactly what this project does and does not prove
Delivered as a 36 KB ZIP. SHA-256 published under Changelog so you can verify it.
System requirements
- Operating system
- Any
- Runtime
- Python 3.10+. Prophet and Streamlit from PyPI — no GPU or API key.
Licence
Learn from it, change it, and use it in your own coursework and personal projects. Do not resell it or pass it off as your own original work.
- Personal and educational use
- Modifying the code however you like
- Using it as the basis of your own coursework, with honest acknowledgement
- Putting your modified version in a portfolio or on your own GitHub
- Reselling or redistributing the project, modified or not
- Presenting it as your own original work
- Commercial deployment — see the Commercial licence
Support window: 6 months from download.
Frequently asked
Is this real sales data?
No — it is synthetic, generated by a seeded script that ships with the project, and the README says so plainly. There is no licence-clear real Indian daily retail dataset available to redistribute. The generator produces a realistic shape (weekly pattern, salary-day bump, real Diwali dates with a ramp-up and fall-off) and regenerates byte-for-byte identical, so every number in the README is reproducible on your own machine.
What is a walk-forward backtest, and why does it matter?
It fits the model only on data strictly before a chosen holdout window, then predicts that window and compares against the real values that were withheld. It matters because it is the only way to get an honest accuracy number: a model scored on data it was fitted on will always look good. Without a backtest, a forecast chart is a drawing, not a measurement.
Does the holiday feature actually help?
Yes, and the project measures it rather than asserting it. On a 175-day holdout spanning Diwali 2025, MAPE is 2.90% with the holiday regressor and 5.24% without. On Diwali itself the model with the feature predicts Rs 17.3 lakh against a real Rs 14.9 lakh, while the model without it predicts Rs 7.4 lakh — barely half. Two Diwalis is a thin sample for the effect's exact size, and the README says so.
Changelog
- First release
SHA-2564851d368e6dcaa9d071d798bce6d7623a24e11b1acb7d5c04de8667370f327d4
You might also like
 Free
Free Data Analysis with pandas
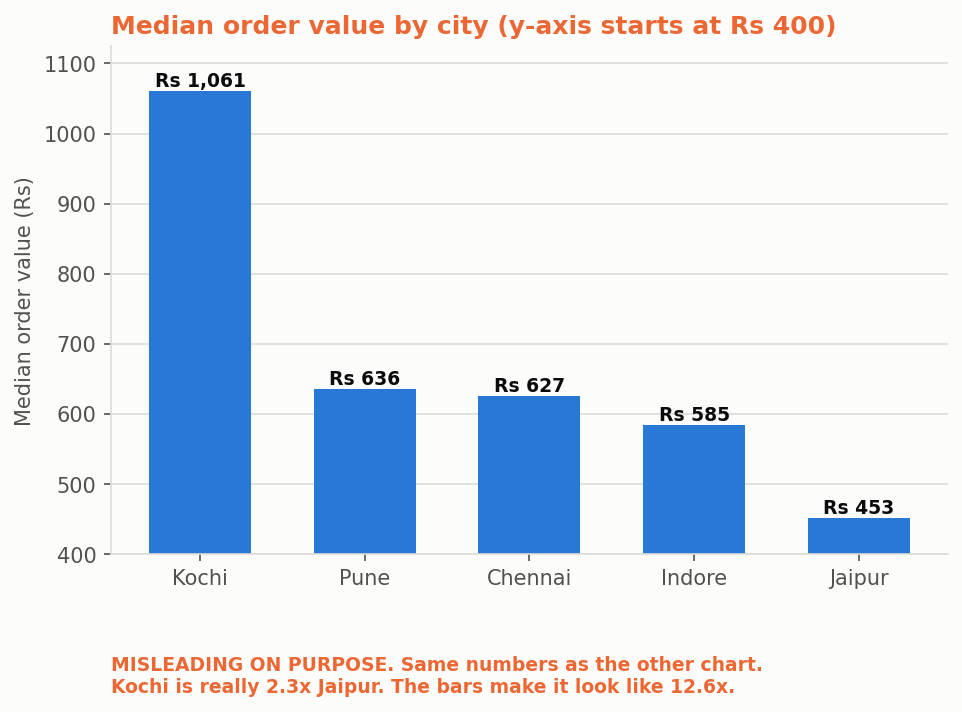
The summary statistic you choose is an argument, not a neutral fact.
- Python
- pandas
- Matplotlib
 Premium
 Report Automation
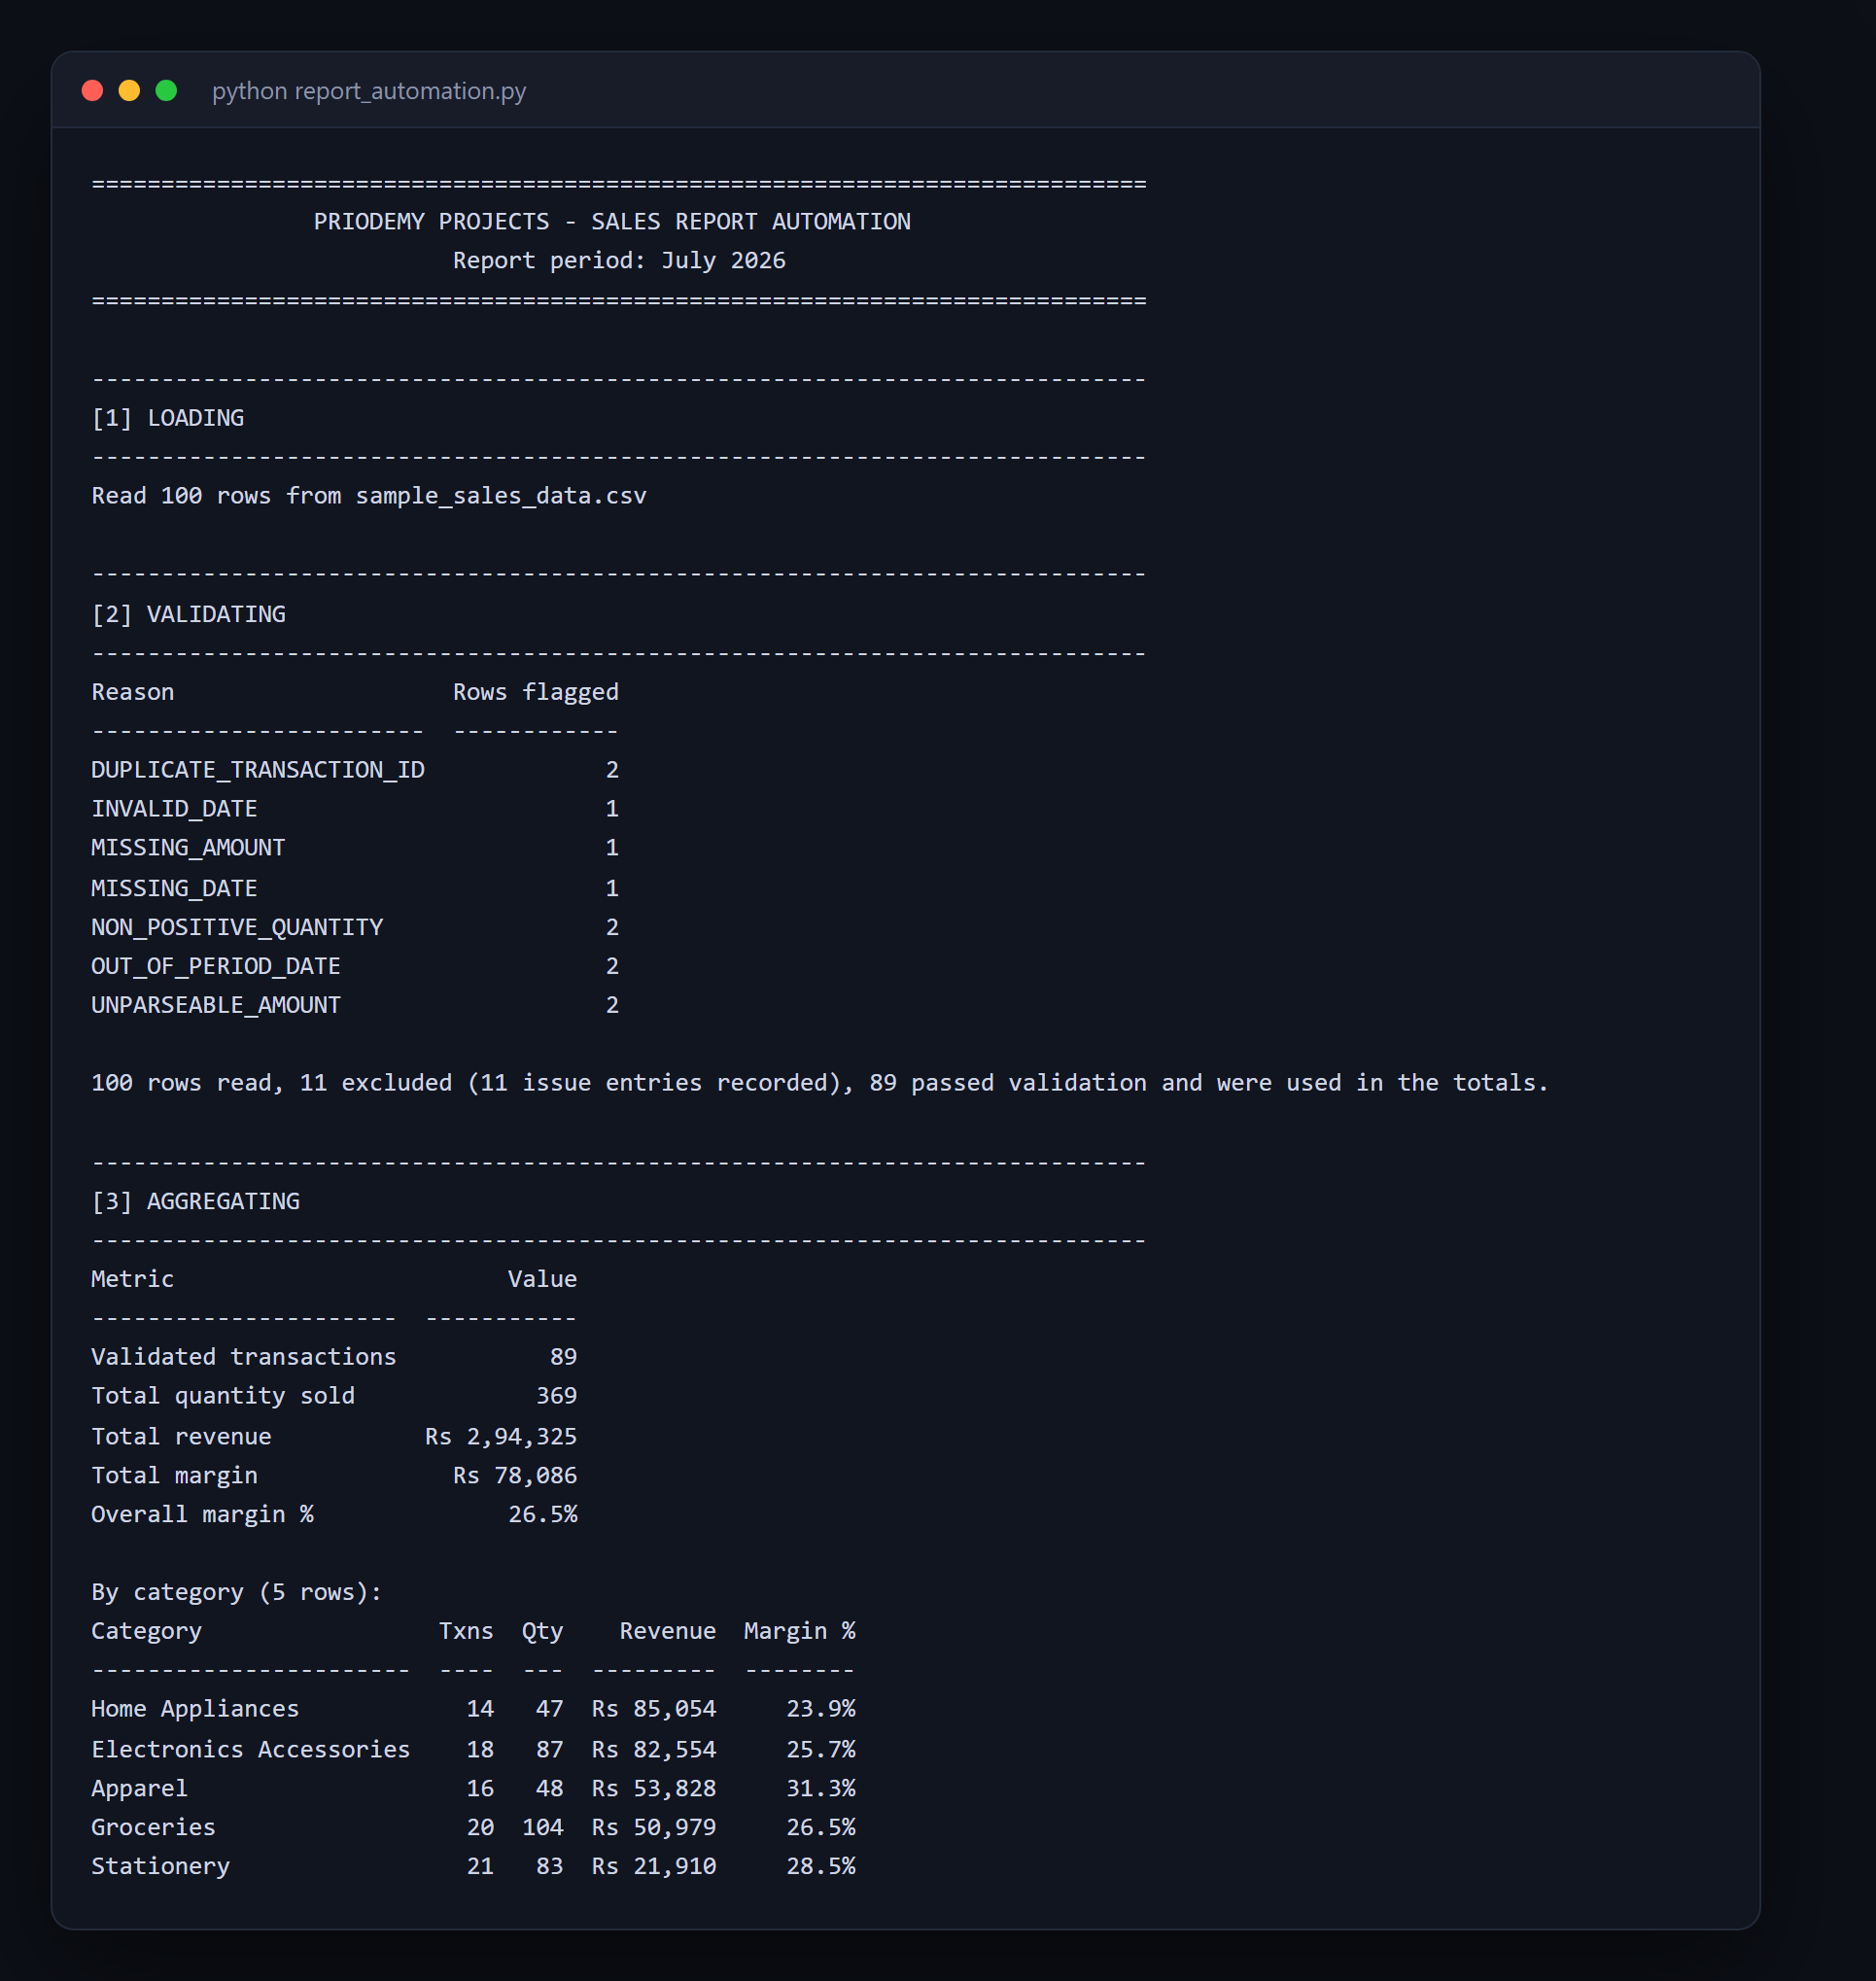
A report that silently trusts its input produces a polished, wrong number — and nobody double-checks a report that looks finished.
- Python
- openpyxl
- pandas
 Free
Free Retail Database Design (SQL)
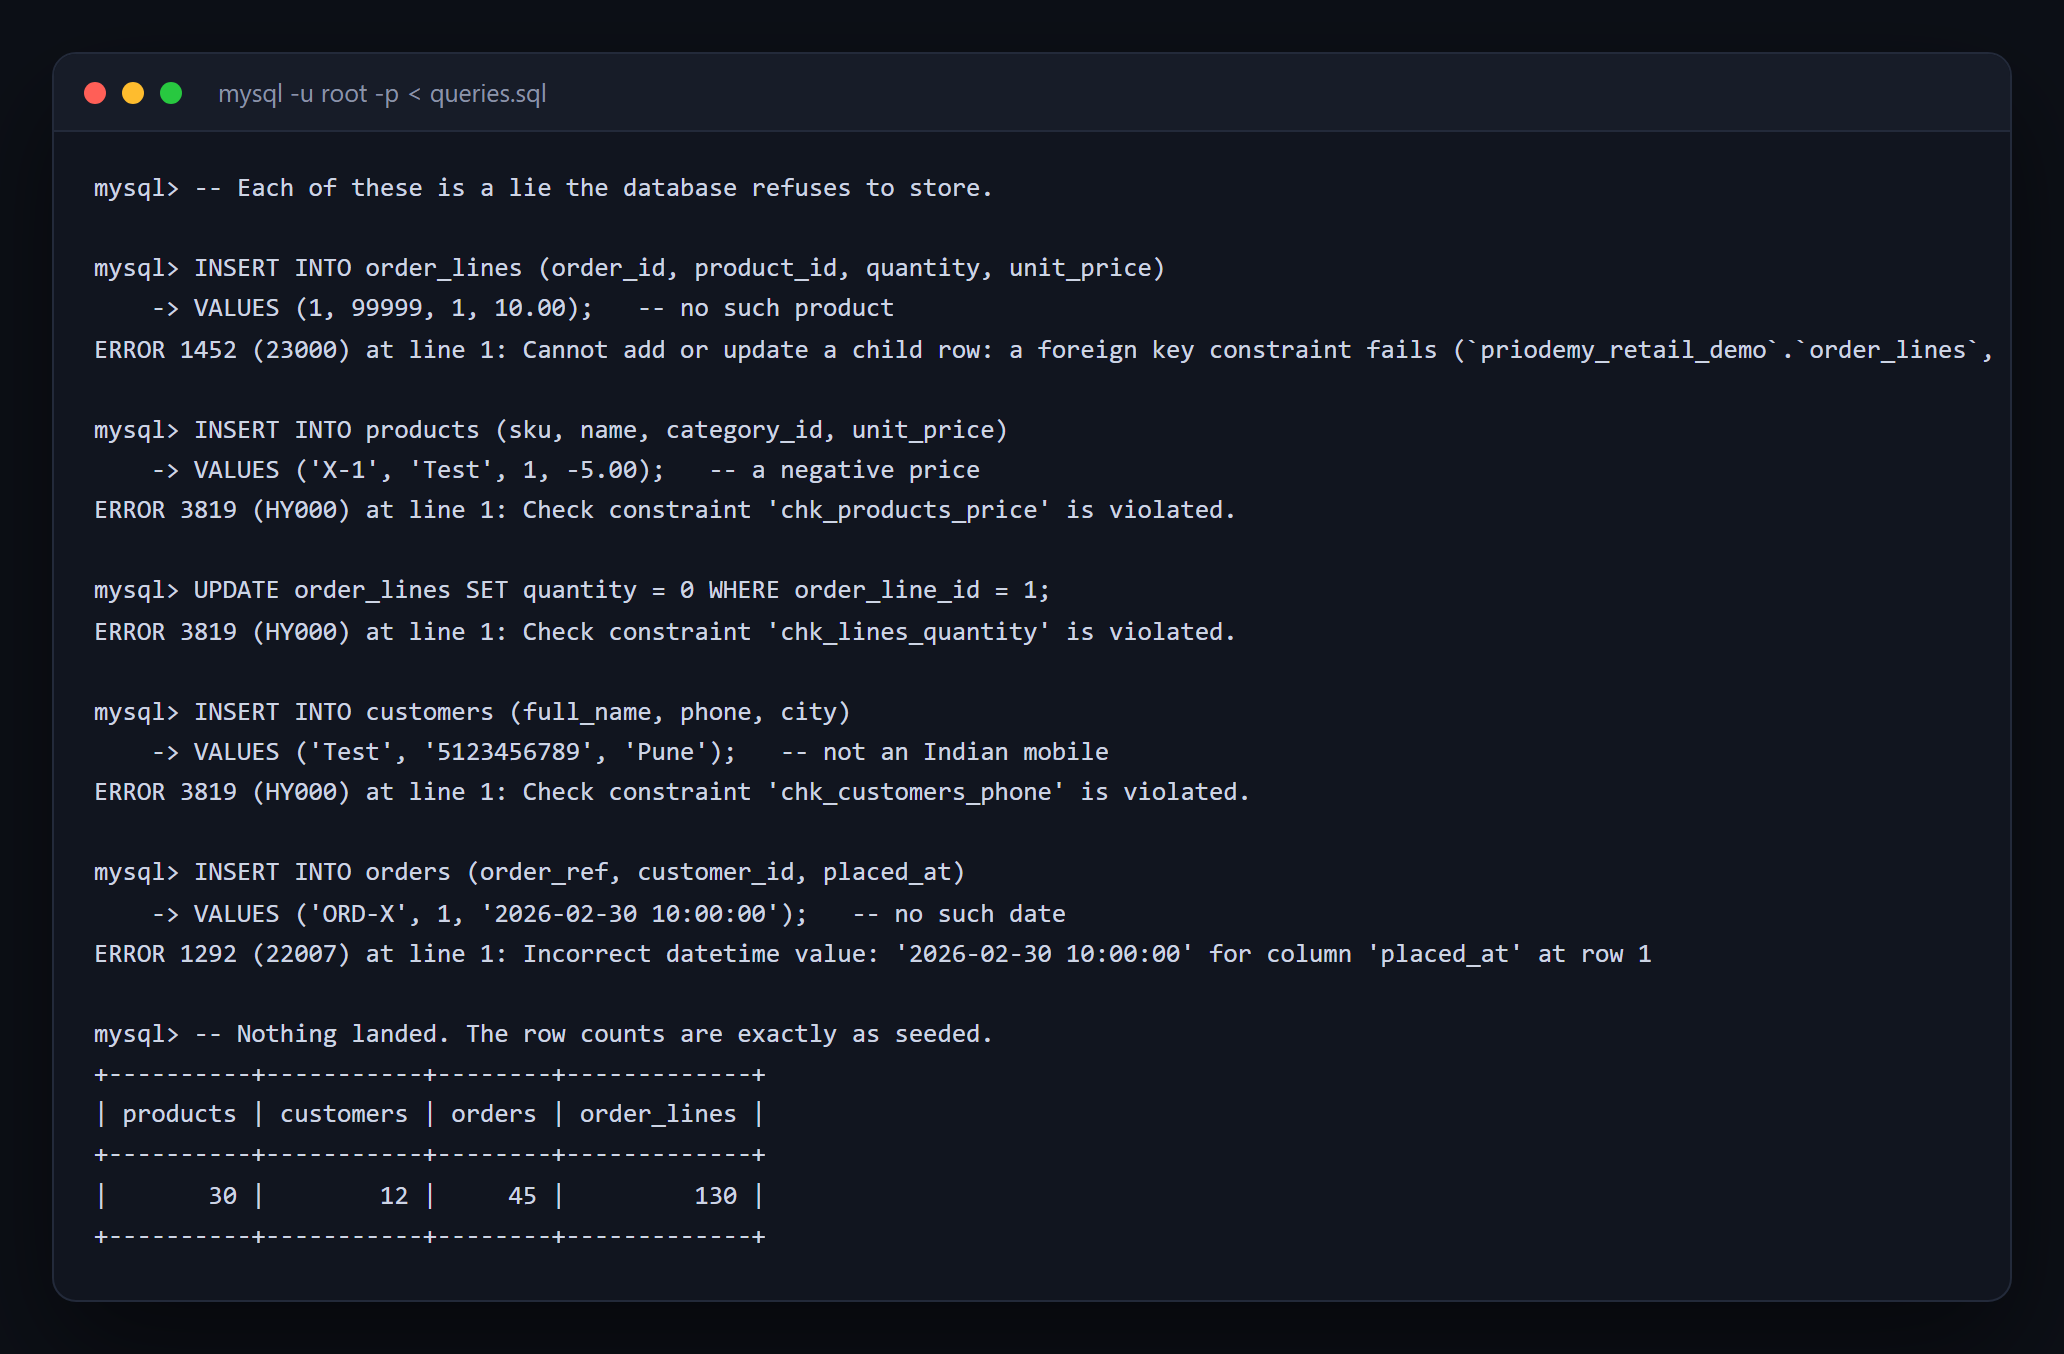
Normalisation is not bureaucracy — it is the prevention of lies, and the error message is the feature.
- SQL
- MySQL
 Free
Free ATM Simulation System
A working cash machine in Python and MySQL — balance, withdrawal, deposit and a transaction history.
- Python
- MySQL
- mysql-connector